Insights and Updates - New
Note: This article was originally published here
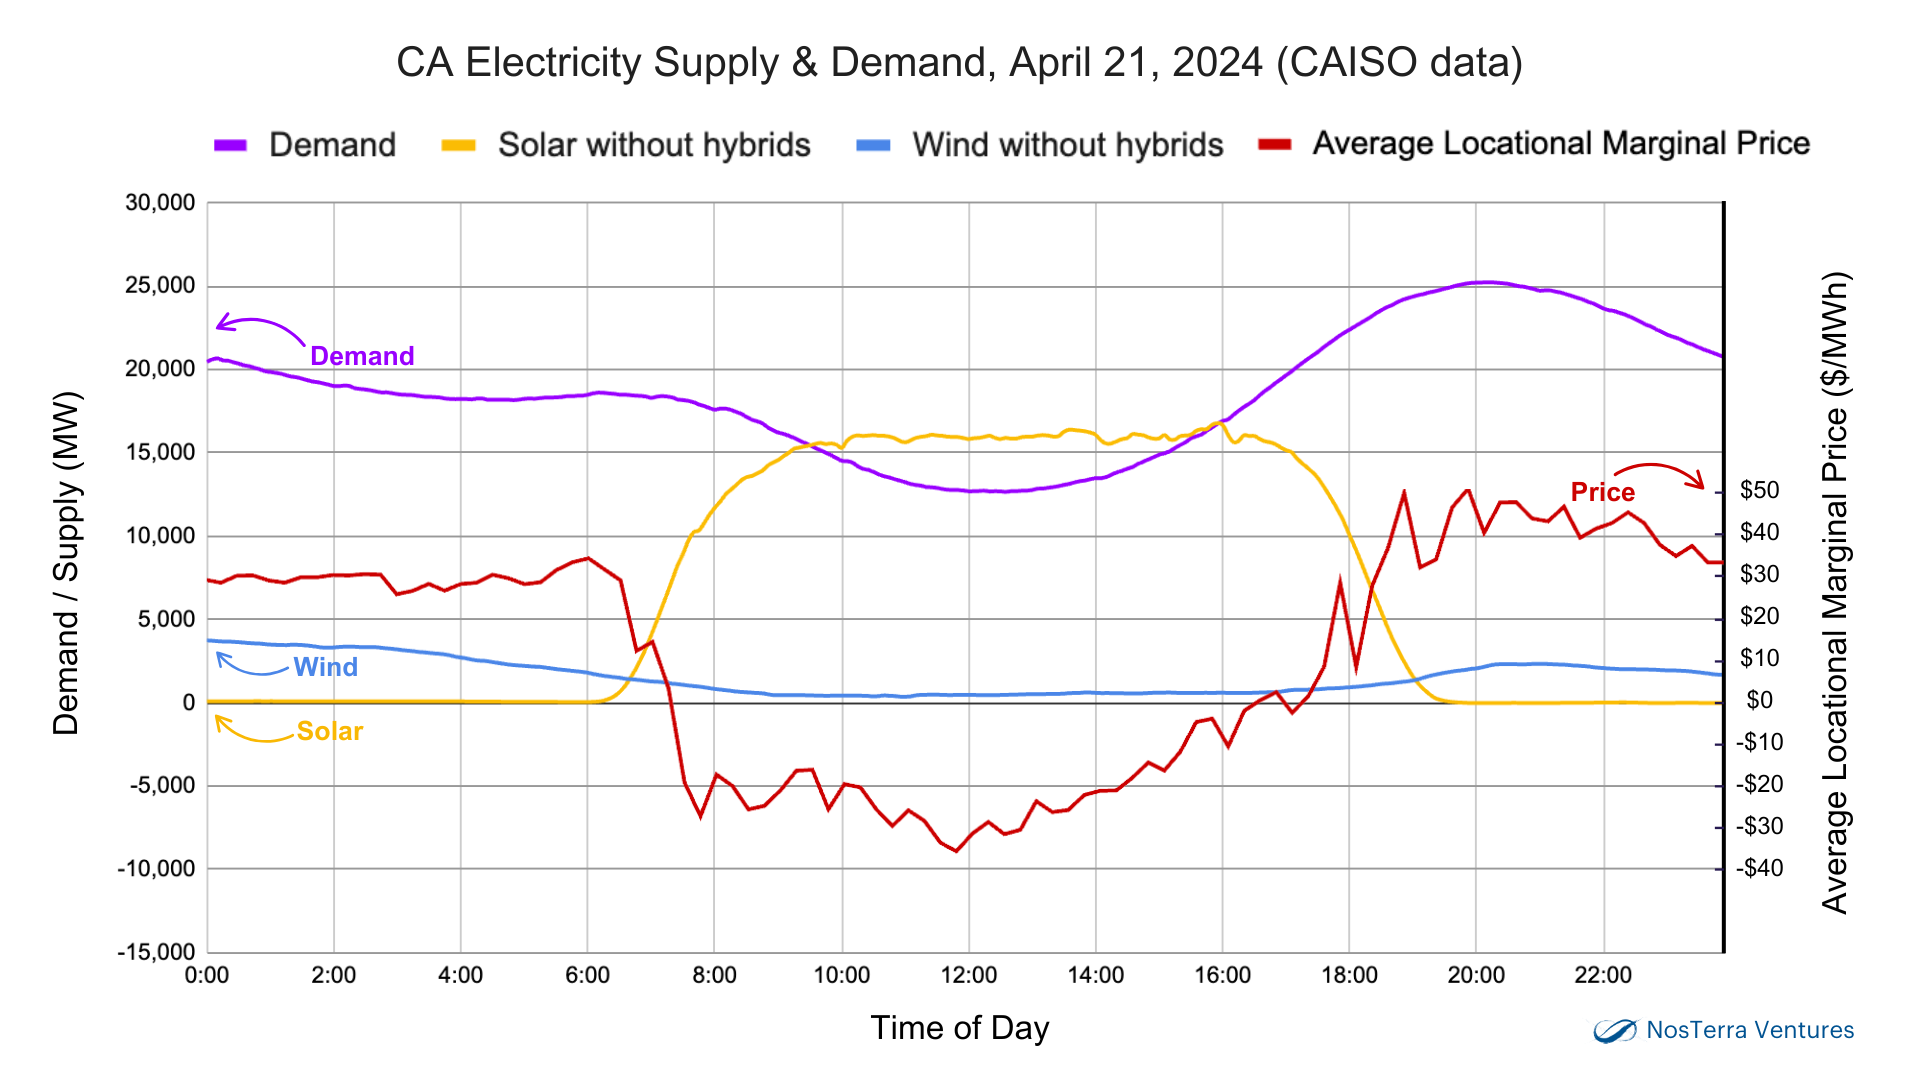
A diversity of energy sources has been a huge benefit to California’s energy markets. In this chart I have overlapped two highly related topics onto a single slide. The data is from April 21, 2024, and is chosen as a point in time.
The demand curve shows power consumption in the state of California, while the other curves show the amount of electricity generated by solar and wind. What you can see is that during the roughly 10 hours when the sun was shining, most of the state’s power was provided by solar.
Also plotted on the same timescale is the average marginal price of energy, which is set by the California Independent System Operator (CAISO www.caiso.com), and is based on the bids of sellers (power generators) and buyers in a real-time wholesale electricity market.
For my current purposes, marginal pricing shows the impact that solar has on the cost of energy when managed in a commoditized market. On April 21, 2024, nearly 40% of California’s energy was provided by solar, and during the day, the marginal price of energy dropped substantially, by as much as $80/MWh or about $0.07-$0.08/kWh. Added up over a ten hour period, this is a substantial reduction in the overall cost of wholesale energy.
Net/net, solar is a major supplier of electricity in the state of California and it has dramatically reduced the energy costs for our state. This reinforces the fact that the most critical element in reducing wholesale energy prices is the operation of broad energy markets with a diversity of energy sources. I am also very optimistic about the development of various energy storage technologies and the impact they can make in pricing, as they can ensure a highly competitive market across 24 hours a day.
📊 Data sources:
• https://www.caiso.com/todays-outlook/demand
• https://www.caiso.com/todays-outlook/supply
• https://www.eia.gov/electricity/wholesale/
— Dave Welch
🔍 Search
Note: This article was first published here.
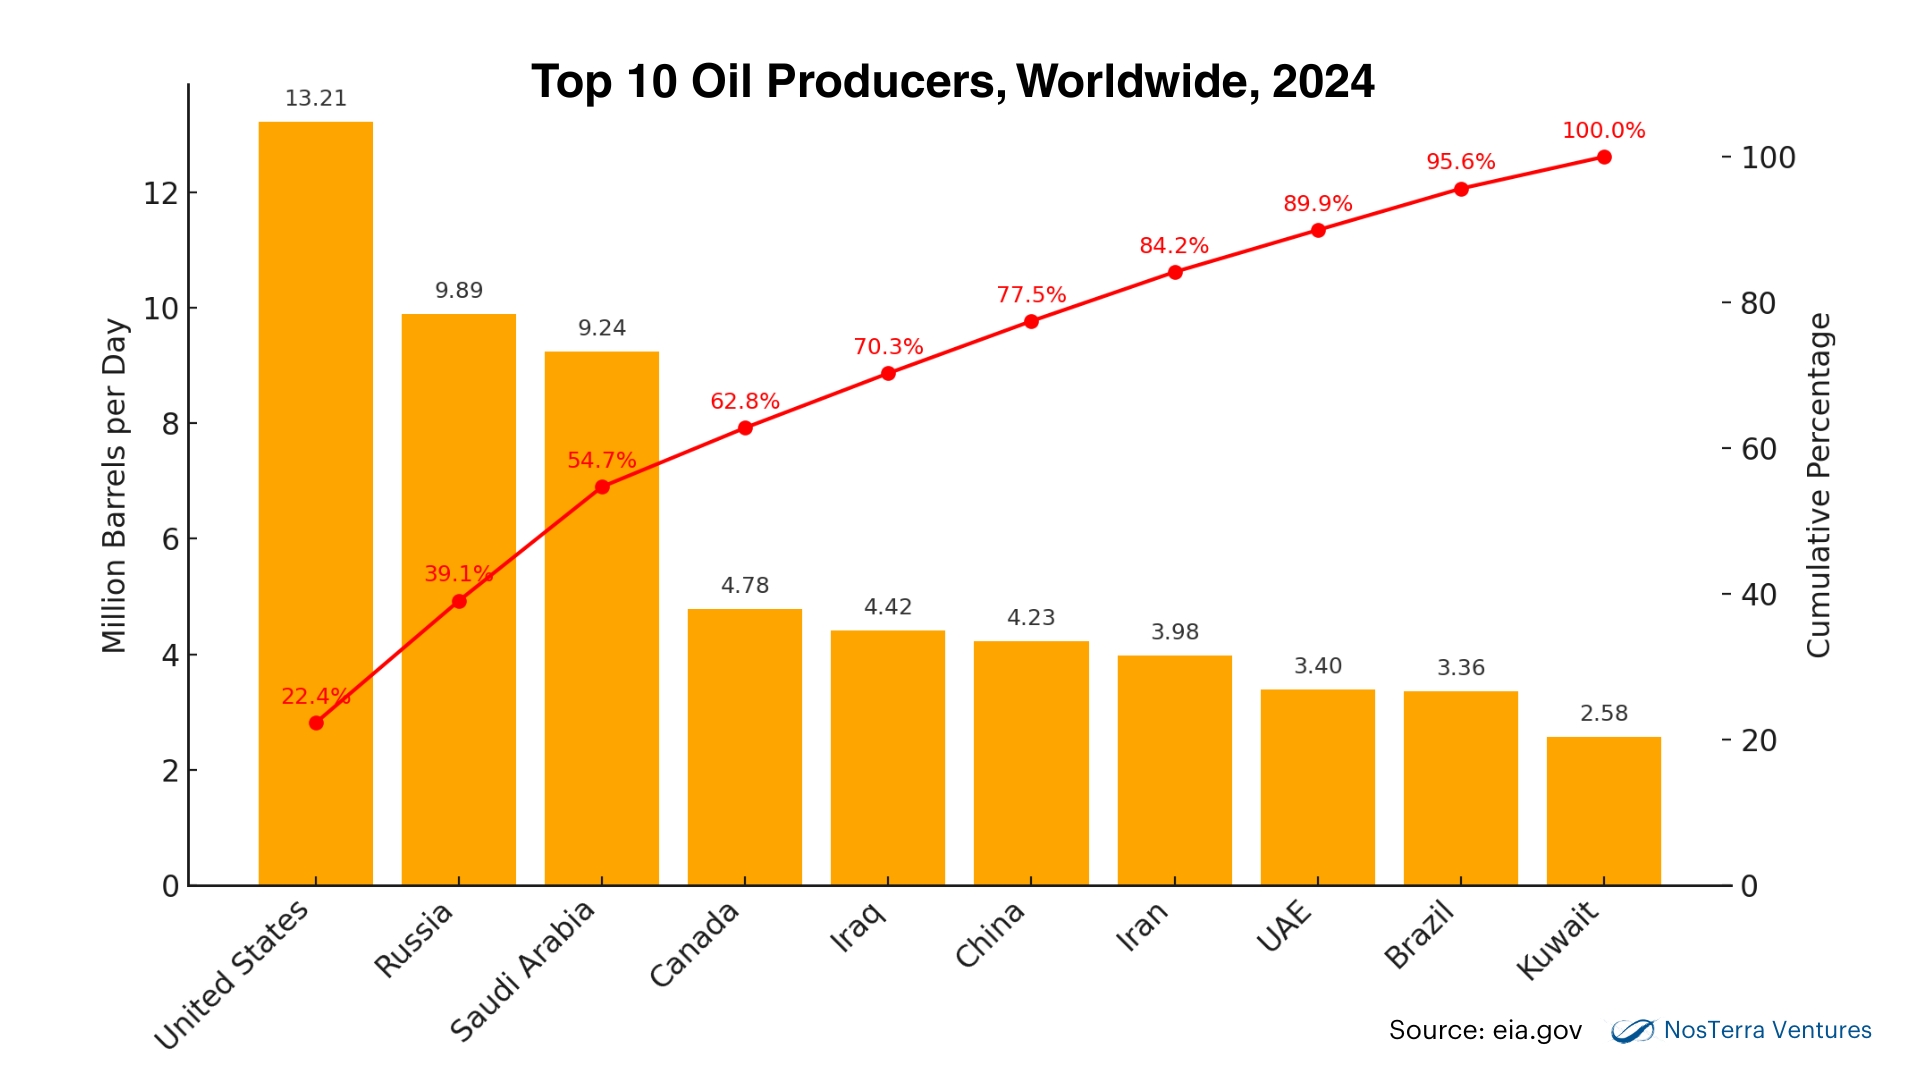
In 2024, the U.S. produced over 13 million barrels per day of crude oil, and we are now the largest oil producer in the world.
When it comes to profit, however, American oil producers are watching their margins, because the cost of extraction here is significantly higher than in other countries. In fact, among the world’s four largest oil producers, the production cost per barrel would be ranked with Canada as the most expensive, the United States next, then Russia and Saudi Arabia as the cheapest.
According to the U.S. Energy Information Administration (eia.gov), the average break even price for oil from the Permian basin, which accounts for almost half of all U.S. crude, was between $62-64/barrel last year, while crude oil prices averaged $77 per barrel.
This puts American oil producers in a very tenuous position when the price of crude drops. Despite President Trump’s declaration to “Drill, Baby, Drill,” oil producers have their own ideas about their growth plans.
One oil executive recently said, “There is constant noise coming from the [Trump] administration saying $50-per-barrel oil is the target. Everyone should understand that $50 is not a sustainable price for oil. It needs to be mid $60s.” (This is from a recent survey conducted by the Dallas Fed of 136 exploration and production firms.)
It’s worth noting that the EIA predicted this month that Brent crude oil prices would average less than $70 per barrel in 2025 and about $58 per barrel in 2026. At this rate, the U.S. stands to lose market share faster than any other supplier when narrowing profit margins catch up with the cost of production.
Meanwhile, the Trump administration’s desire to deprioritize renewable energy investment in order to boost fossil-fuel industries is a false dichotomy. Petroleum primarily fuels the transportation industry and plays almost no part in electricity generation. As a country, we need to look at our overall energy supply and how we can fuel the continued growth of our economy — including the massive boom in data centers.
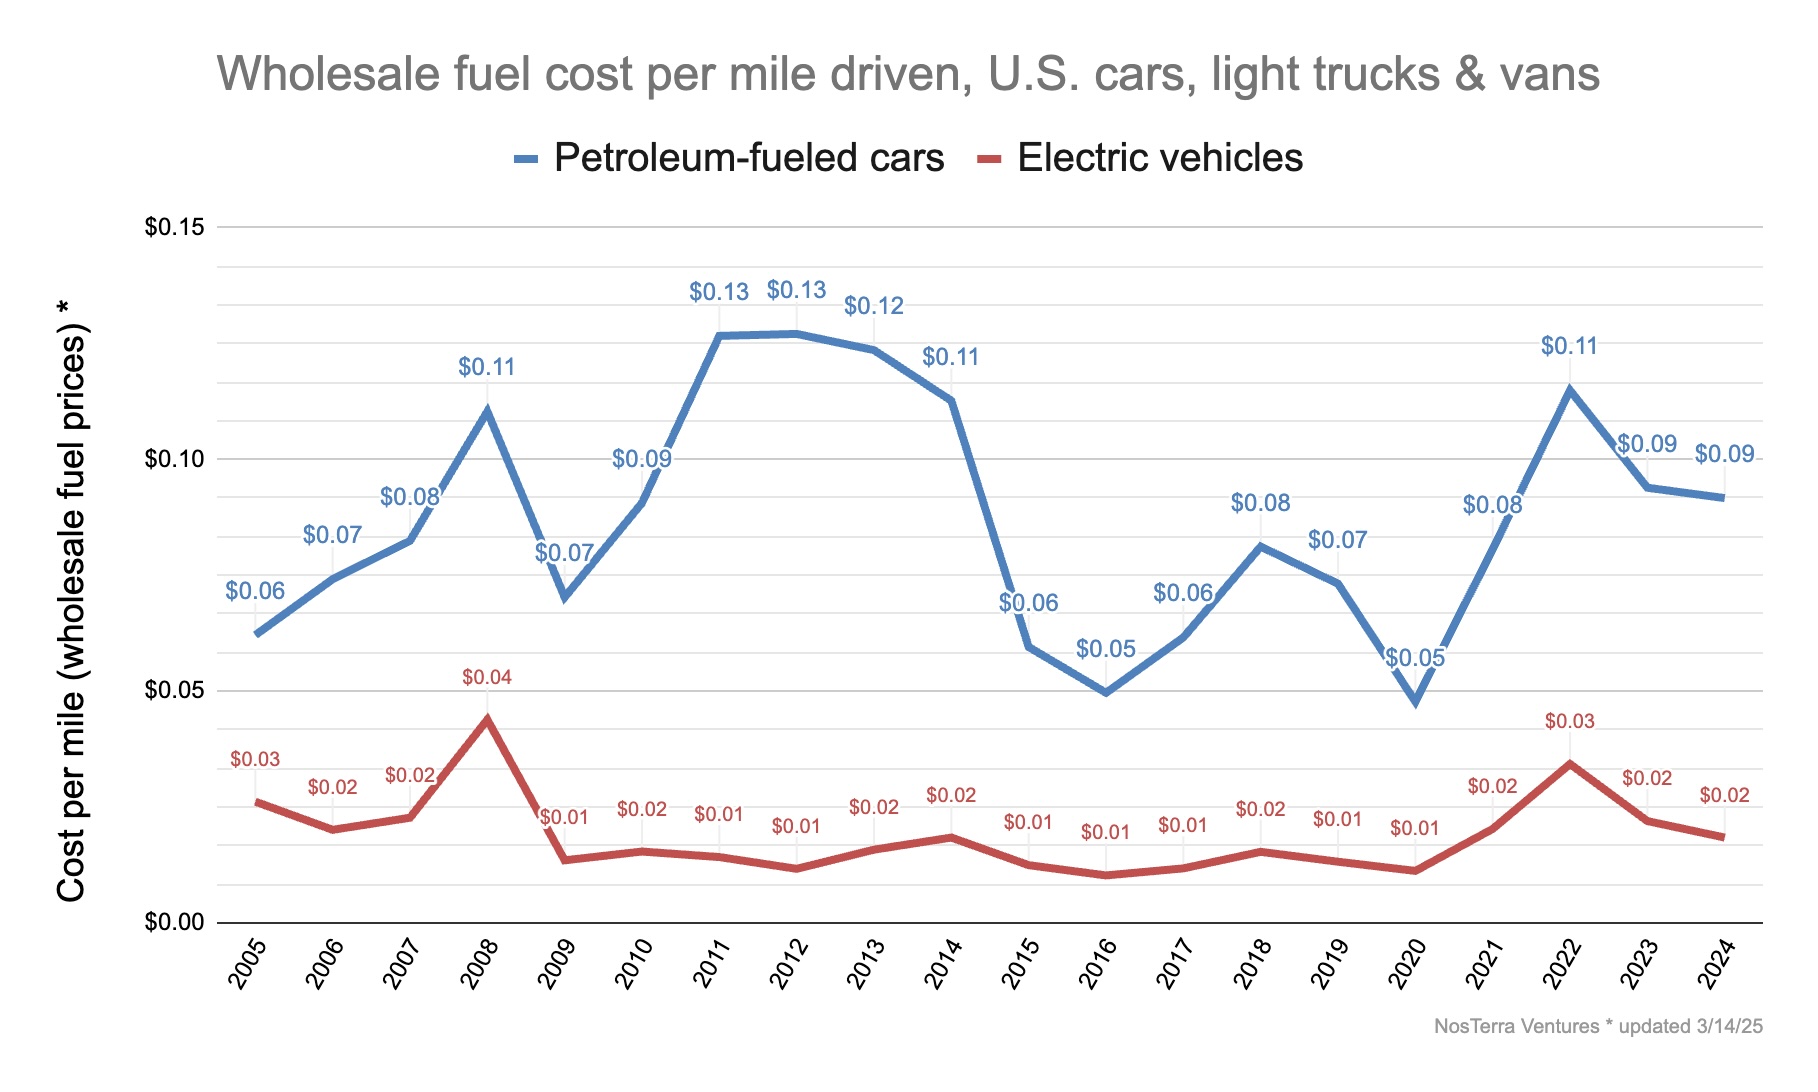
More than that, if we fueled our transportation needs with electricity, we would reap huge savings. As I’ve written before (and many other analysts have also confirmed), the cost to move an electric vehicle is significantly cheaper than a gasoline-powered car, mile for mile.
It’s obvious what the energy of the future will be — the cheapest and most abundant forms — which, by the way, will also be the greenest forms of energy. We need to invest in and be leaders in clean energy so that we can benefit from this multi-trillion-dollar market, not ignore or stifle it.
Sources:
• https://www.dallasfed.org/research/surveys/des/2025/2502
• https://www.eia.gov/todayinenergy/detail.php?id=65024
— Dave Welch
Note: This article was originally published here
Previously I analyzed a sankey diagram of energy flow in the U.S., and now I’d like to compare that national snapshot to the state of California’s energy needs, with a specific focus on the electric grid markets (links to my previous posts are in the comments below).
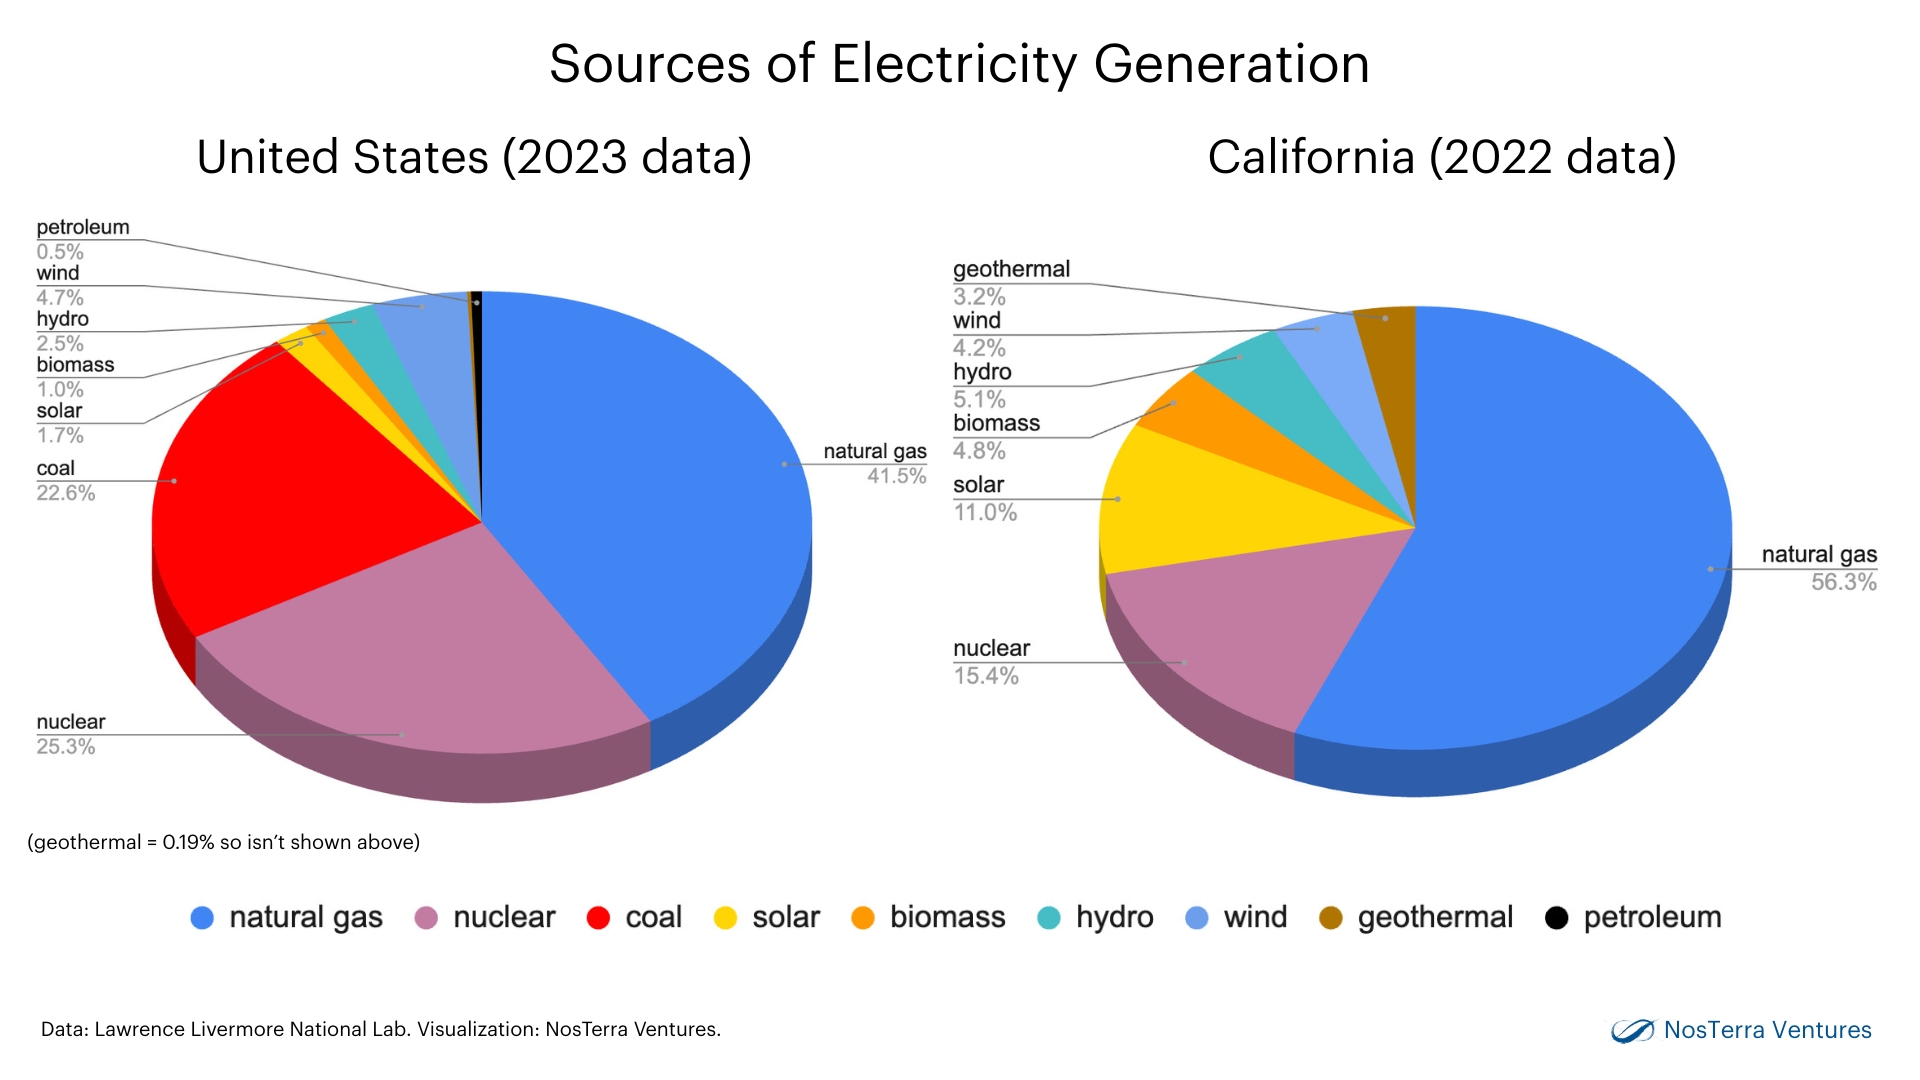
The combustion of natural gas provides the largest source of electricity to the grid, both nationally and in California. Emission-free energy sources, like solar, wind and nuclear, provide 44% of California’s electricity, compared to the national average of 36%.
One thing that distinguishes the Golden State is the use of coal, which accounts for more than a fifth (23%) of electricity generation nationally, but is non-existent in the California market. Even nationally, coal’s market share has dwindled, down from 50% a few decades ago. This loss of market share is mainly due to natural gas being cheaper than coal and to a relatively low capital investment required to convert a coal-fired power plant into a natural gas plant.
There is effectively zero presence of petroleum in the electric grid marketplace at the state and national level. This, too, is tied to the economics of petroleum. Until the recent development of advanced high energy density batteries like Li-ion, the market for vehicle fuel was almost exclusively served by petroleum, a resource whose pricing and supply are controlled by cartels.
Now that advanced battery technology is readily available, electricity can compete in the transportation marketplace. Fueling a mile in an electric vehicle (EV) is more than 5x cheaper than in a petroleum-fueled vehicle, because energy sources must compete like commodities on the electric grid. Additionally, EVs have a higher energy conversion efficiency.
If we embrace the conversion of the transportation market from petroleum to electricity, it will both save the U.S. economy $6 trillion over the next 20 years and reduce our carbon footprint substantially.
There will be a lot to watch for in the coming years. Currently, the cheapest energy sources for the electricity grid are natural gas, solar, wind and geothermal. The latter three sources, which are all emissions-free, are growing rapidly, but our energy markets are so large that it will take a long time to see them take over dominant market shares.
Another important dynamic will be driven by the growth of zero-emission technologies: As the size and presence of renewable energy sources expand, their associated cost structures will continue to drop, making them an increasingly attractive option economically.
And then there is the acceleration of AI data centers, which will drive additional investment into the grid and electricity infrastructure needed to meet our future computing needs, while also adding economic incentives to advance low cost energy technologies.
All of this transformation is based on economics, and economics will be the driver for an expanding market for zero-emissions energy in the coming decade.
— Dave Welch
Note: This article was originally published here
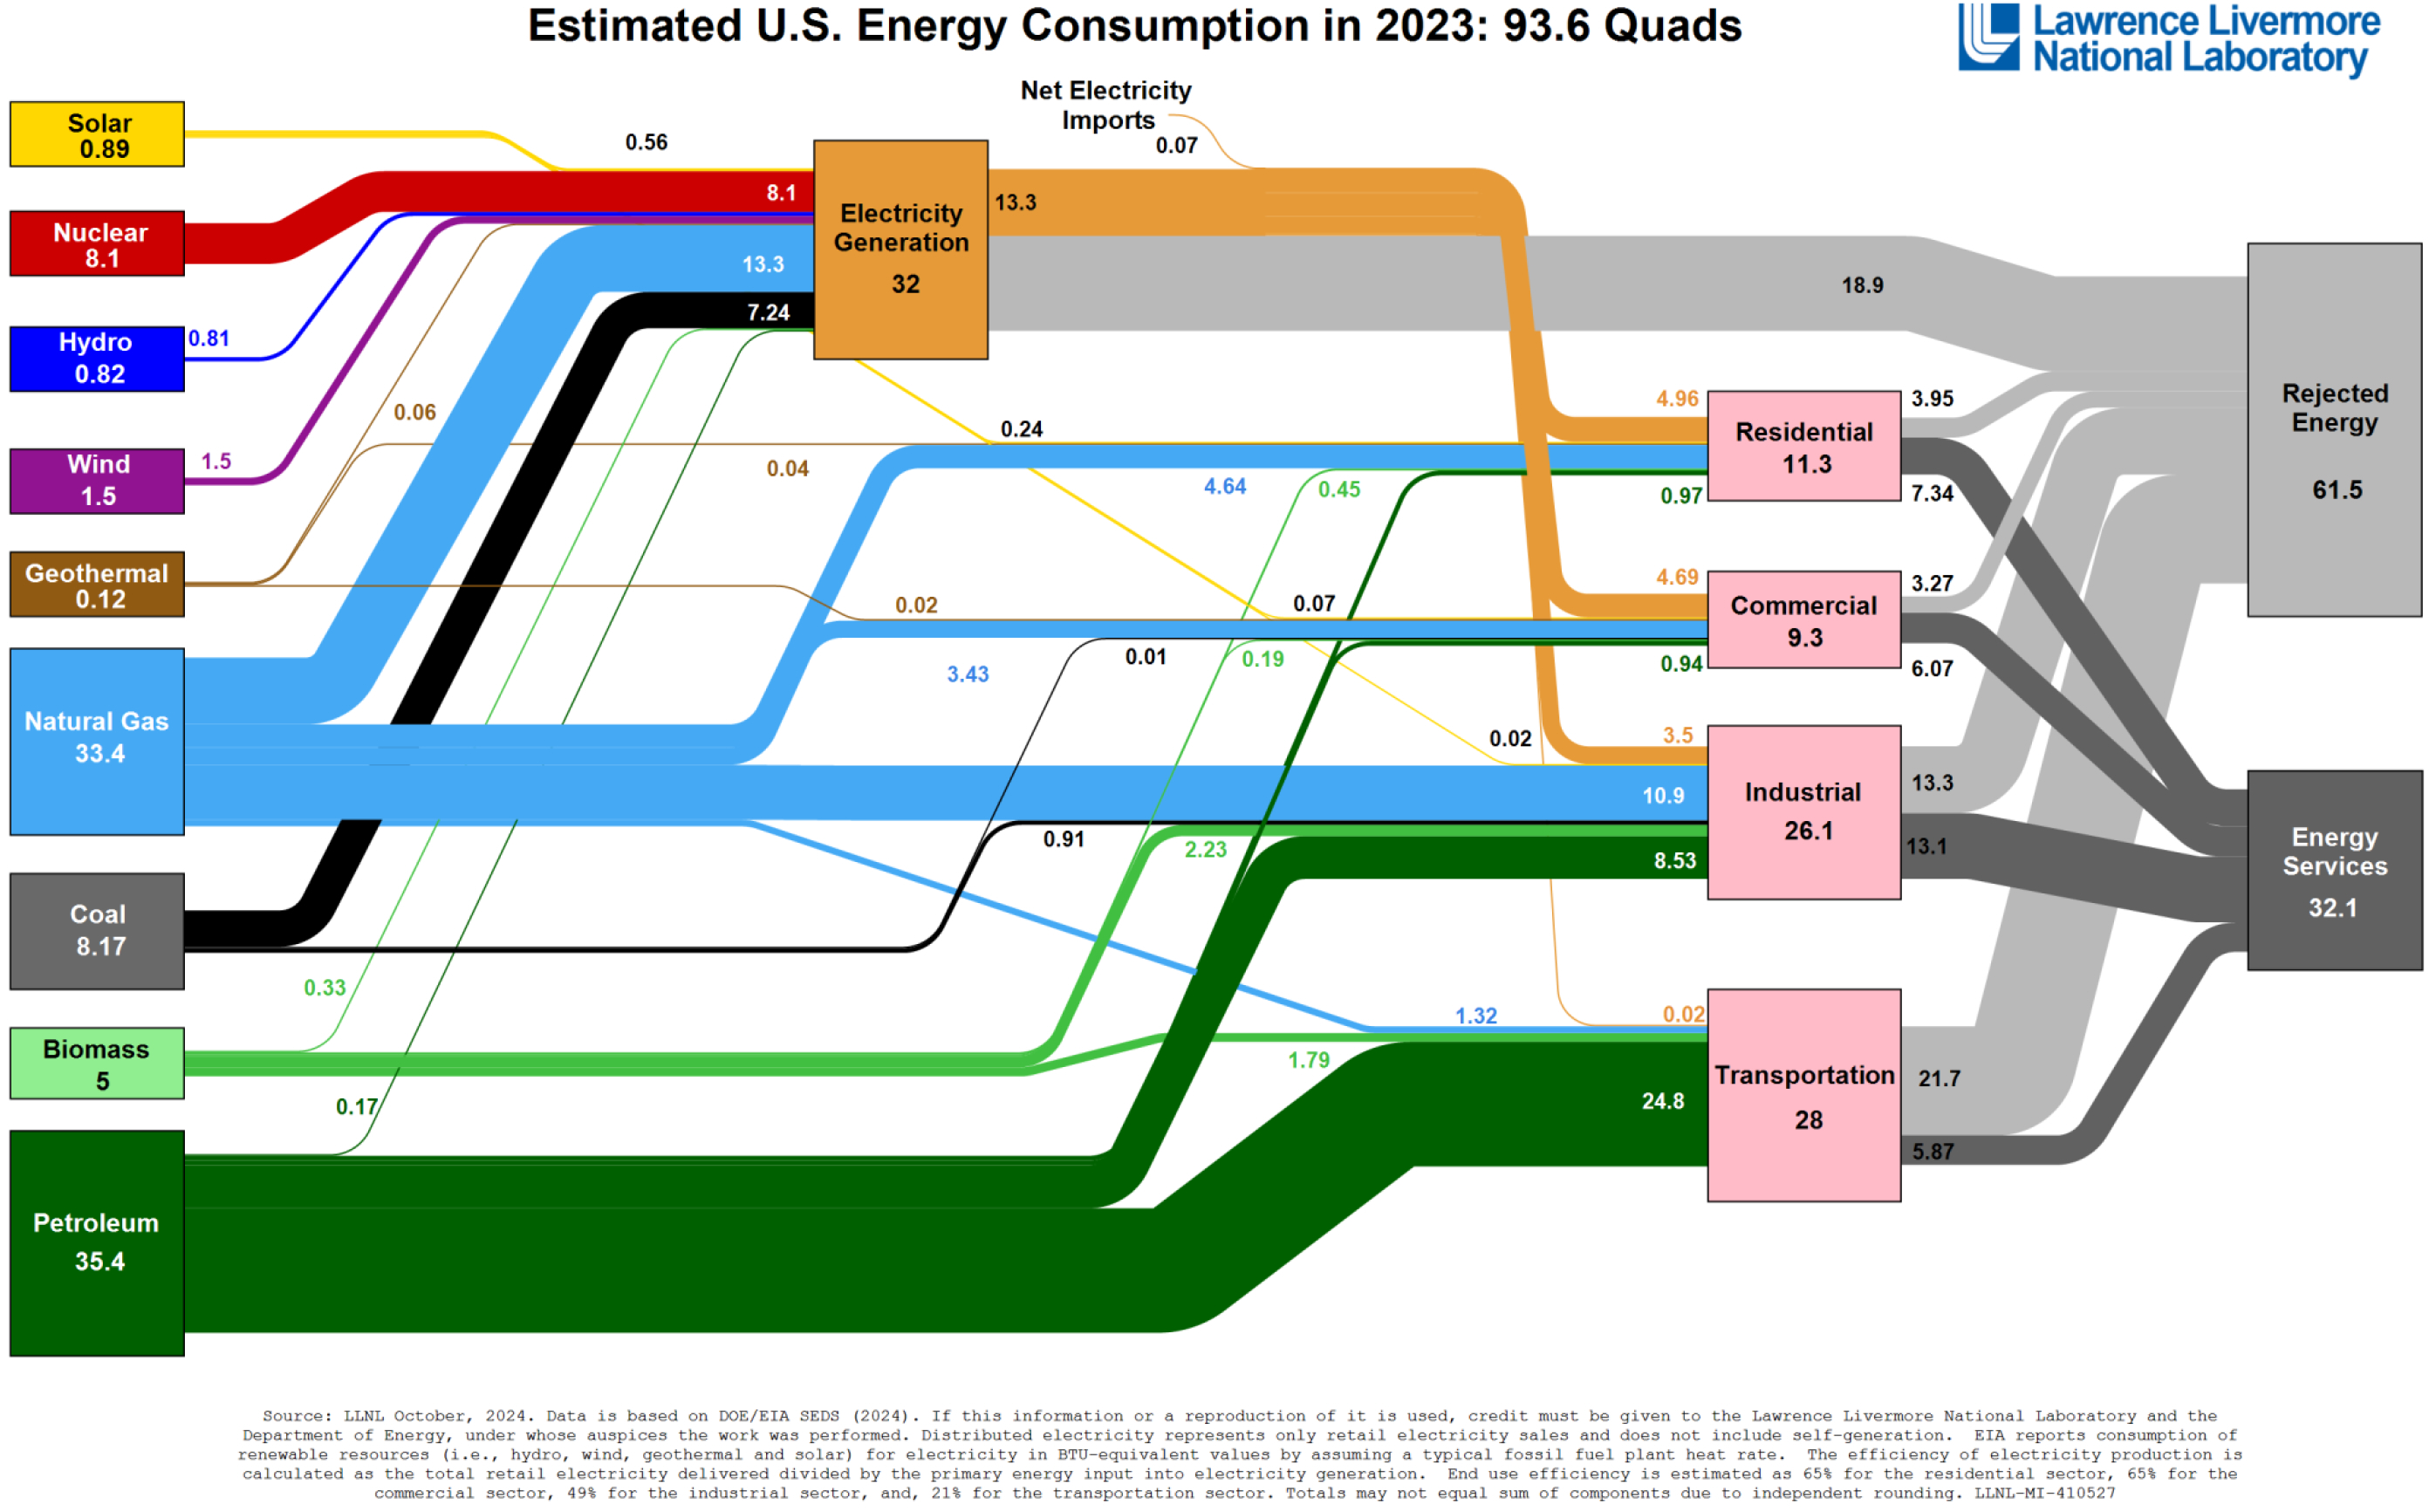
This is one of my favorite charts about energy, a sankey diagram showing U.S. energy flow in 2023, published by Lawrence Livermore National Laboratory (DOE).
The chart shows where energy is coming from and where energy is being used, and here’s my biggest takeaway: If we adopted more efficient energy sources, both emissions and the price of energy could be dramatically reduced.
Let’s dig in. The first item to note is that currently roughly 2/3’s of all energy is lost as heat (what’s labeled as “rejected energy” on the chart). That’s a lot of wasted energy.
The chart also shows three very different energy markets: the electricity grid, the petroleum-fueled transportation market, and the natural gas-based industrial or point-of-load market. Of these three markets, only the electricity market allows different energy types to compete head-to-head on a price basis.
Petroleum markets are influenced by cartel pricing, as discussed in prior posts, and as a result, are substantially more expensive per unit of work performed. In addition, petroleum energy conversion is highly inefficient. In the U.S. transportation sector, 28 quads of energy (89% of which is petroleum) were input and only 5.87 quads of work were output — that’s only 20% efficient.
In comparison, electricity generation is 42% energy efficient (note the 13.3 quads of work done coming from an input of 32 quads of energy). That’s more than double the efficiency.
And that’s one of the reasons it makes sense for the transportation sector to electrify.
The electricity grid is supplied by 41% natural gas, 35% no- and low-carbon sources, and 22% coal. Trend lines show that coal is losing market share to natural gas and clean energies, a change that’s driven by coal’s greater cost structure.
Based on price, the market’s natural tendencies will support increasing market share for natural gas and clean energy technologies.
The difference in carbon emissions is also substantial. Currently, the transportation sector emits 312 million metric tons of carbon for each quad of work performed, while the electric grid emits 115 million metric tons of carbon per quad. This is a 2.7x difference in carbon emissions.
A competitive market is critically important in determining the economics of our energy system and in moving us towards a clean energy transition. In parallel, we should electrify transportation and replace the costly and dirty energy sources on the current electricity grid (namely coal and older natural gas plants) with lower cost, cleaner, and abundant energy sources.
📚 Background reading
• If you visit LLNL’s website, you can pull up additional flow charts by state and by year: https://lnkd.in/gs4XqSqa
• My previous post about cartel pricing in petroleum markets: https://lnkd.in/gFR_7qUC
— Dave Welch
Note: This article was originally published here.
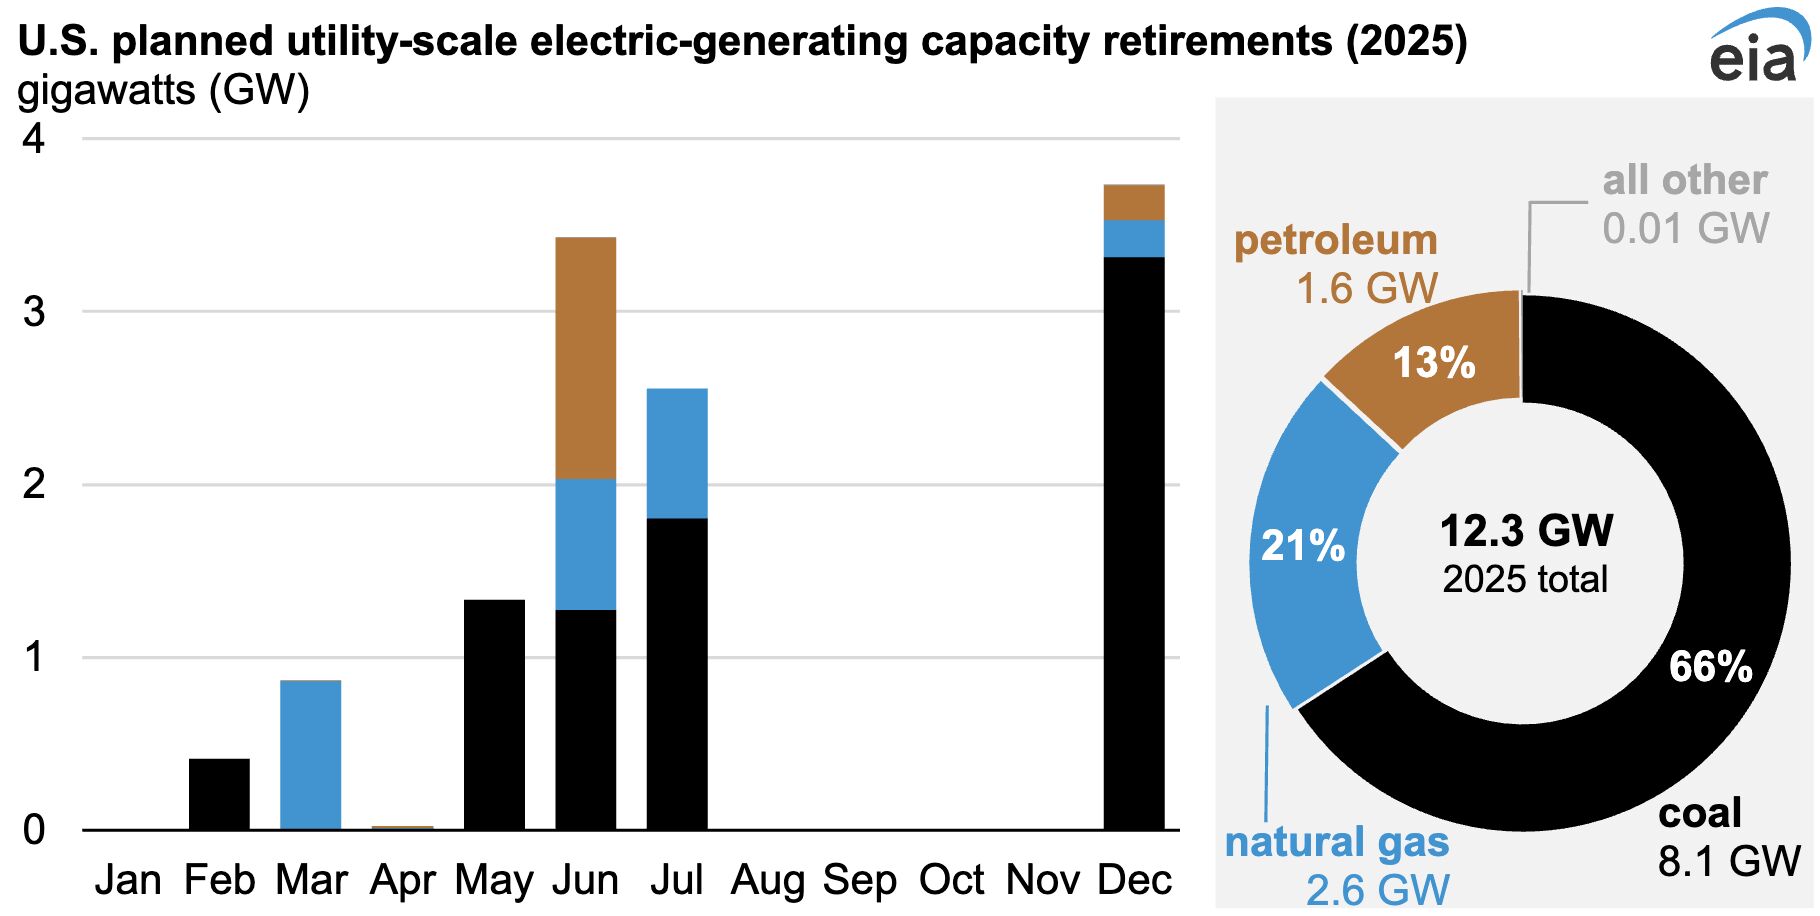
U.S. electric generators plan to retire over 8 GW of coal-fired capacity in 2025 — equivalent to almost 5% of the current U.S. coal fleet, according to eia.gov. Coal has been steadily losing market share for 20 years (it now accounts for only 8% of the U.S. energy supply), but it’s important to understand why.
Some blame it on climate change policies, but the primary reason for retirement is that it isn't economically competitive in the electric grid markets.
As Julianne Geiger writes for OilPrice.com, the reality is that “market forces are proving just as lethal” for coal’s future. “Utilities are opting for natural gas and renewables over coal, both for cost and emissions reasons,” she writes. “Power producers are finding it increasingly difficult to justify the expense of maintaining aging coal plants.”
The chart also shows 1.6 GW of planned retirements for petroleum-fueled plants, and it’s worth noting that petroleum provides only 0.5% of the U.S.’s electricity, according to Lawrence Livermore National Laboratory.
As for natural gas-powered plants, 2.6 GW of retirements are planned, primarily for older, less efficient simple-cycle turbine power plants that were built more than 50 years ago.
In an earlier post, I referenced analysis done by Lazard on the levelized cost of electricity from different forms of generation, and there are many situations where natural gas, solar, wind and geothermal beat coal and petroleum in price. We will continue to see petroleum and coal lose market share simply because of market forces.📚
Background & Sources:
• U.S. Energy Information Administration data: https://lnkd.in/gw3usW6h
• Julianne Geiger’s article: https://lnkd.in/g8WQ-WqP
• Lawrence Livermore National Laboratory data: https://lnkd.in/gs4XqSqa
• My earlier post on LCOE: https://lnkd.in/gGkRabNE
— Dave Welch
Note: This article has been updated. It was originally published here.
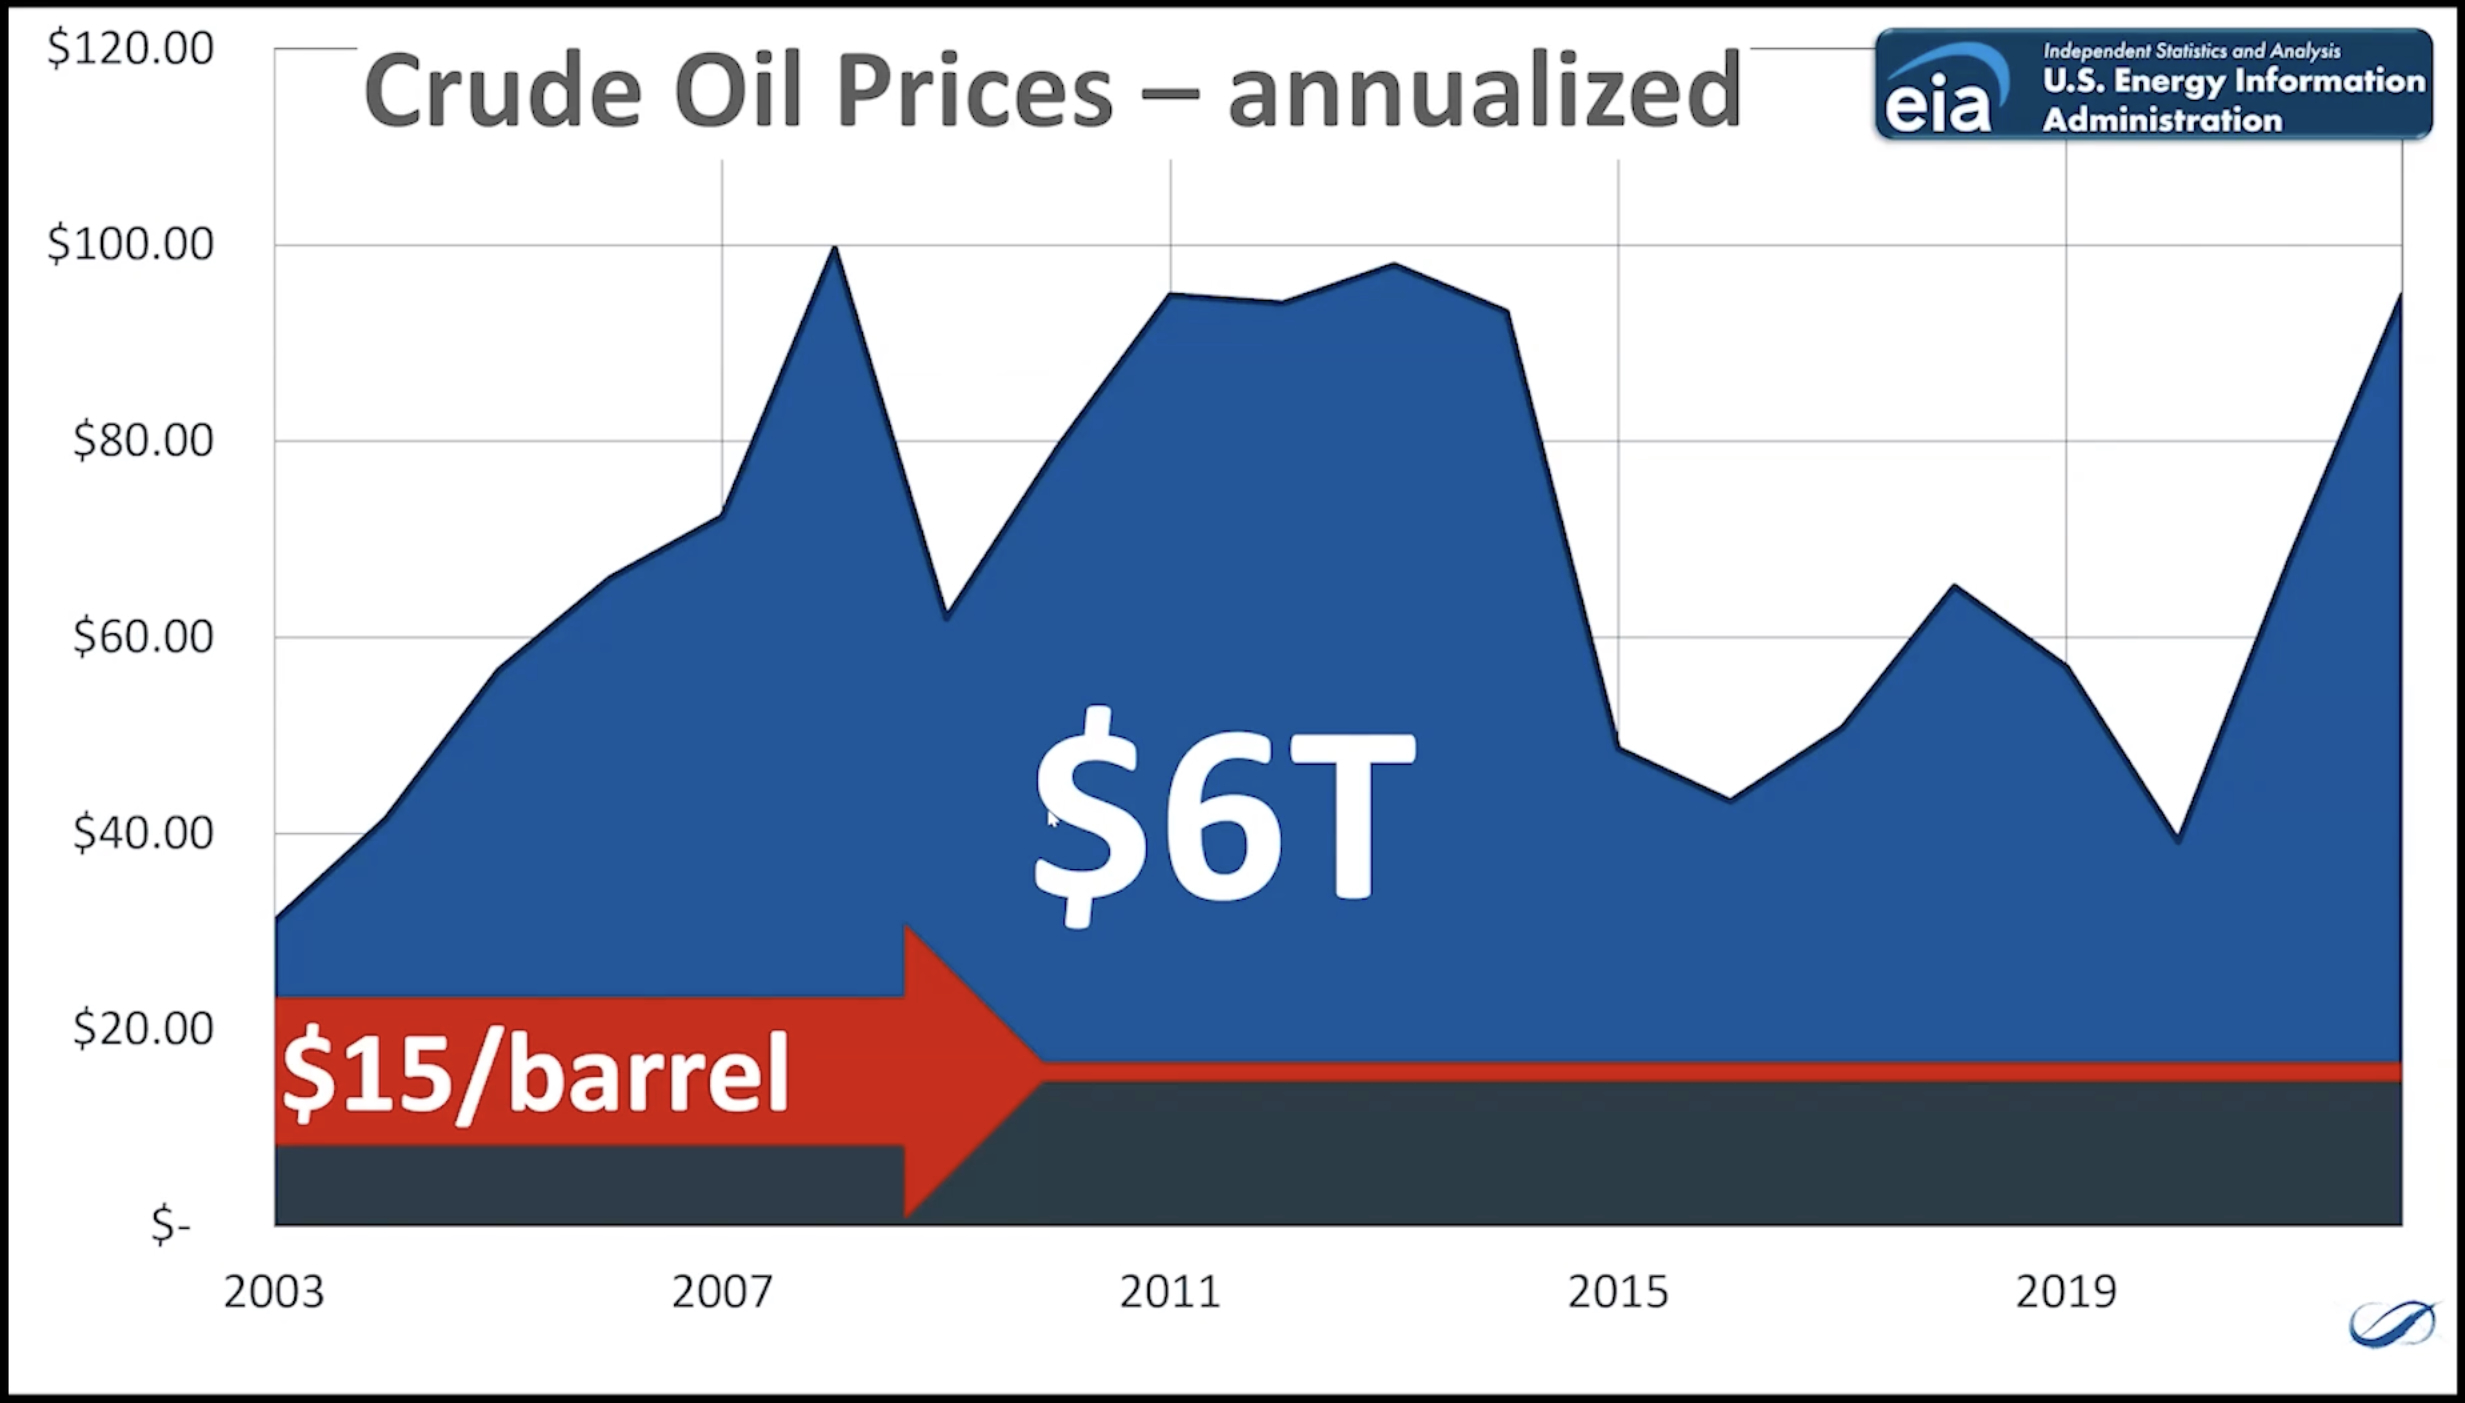
I’m following up on one of my recent posts, in which I argue that driving petroleum-fueled vehicles instead of electric vehicles has cost the U.S. $6 trillion in additional dollars over the past 20 years (links are below in the comments). That cost delta emerges from deriving wholesale fuel costs from two very different markets. One market, for wholesale petroleum, is dominated by cartel pricing that’s controlled by the owners of the raw material.
In contrast, the electricity grid treats energy as a commodity and sells kilowatt hours. All electricity generation needs to compete against all other sources in a market that is constantly searching for the lowest price at any given time of day. The result is a radical reduction in the cost to fuel a car that buys its energy off the grid.
Let’s run through the calculation in detail. I’m going to start by limiting this discussion to wholesale pricing to avoid the various taxes that exist on retail pricing. I am also going to limit it to passenger vehicles and light trucks and vans because that market drives overall pricing, those vehicles have the highest fuel efficiency, and there are readily available electric-powered alternatives.
The average price of crude oil over the past 20 years rounds out to be ~$75/barrel. One barrel of crude produces 20 gallons of gasoline after the refining process.
In 2023, Americans drove 10,565 million miles in their cars and 11,321 million miles in light trucks and vans, according to the U.S. Department of Energy (DOE).
The average fuel efficiency for cars is 24.4 miles per gallon (mpg), and 17.8 mpg for light trucks and vans, according to the DOE. That means passenger cars get an average of 488 miles out of a single barrel of crude, while light trucks & vans get 356 miles out of a barrel.
Factor in the slightly different percentage of miles driven, the different fuel efficiencies, and the fact that gasoline accounts for only roughly 46% of what’s output from refining a barrel of crude oil, and you get an average wholesale cost “at the barrel” of $0.085 per mile driven in an internal combustion engine car, light truck or van.
To do the same calculation for electric vehicles (EVs), let’s start with the cost of wholesale electricity. Like gasoline, it varies by state and region, but the national average over the past 20 years is $50 per megawatt hour, according to data from eia.gov. EVs have an average fuel efficiency of 346 watt hours per mile, according to various sources.
Therefore, it would have cost us only an average of $0.016 per mile to fuel our vehicles if they had all been electric, taken at wholesale pricing levels. That’s less than 2 cents per mile — and a factor of five difference.
If petroleum had to compete on the electricity market, the wholesale price would have to drop to less than $8/barrel.This is not a question of clean energy versus fossil fuels. It’s a matter of the exorbitant price of petroleum as a fuel.
📚 Background reading & relevant links:
• My previous post: https://bit.ly/4bzzfvB
• U.S. Energy Information Administration (EIA) data for the cost of crude oil: https://www.eia.gov/dnav/pet/hist/LeafHandler.ashx?n=PET&s=RBRTE&f=A
• U.S. Department of Energy (DOE) data on average number of miles driven: https://afdc.energy.gov/data/10309
• DOE average fuel efficiency data: https://afdc.energy.gov/data/10308
• EIA wholesale electricity data: https://www.eia.gov/electricity/wholesale/#history
— Dave Welch
Note: This article was originally published here.
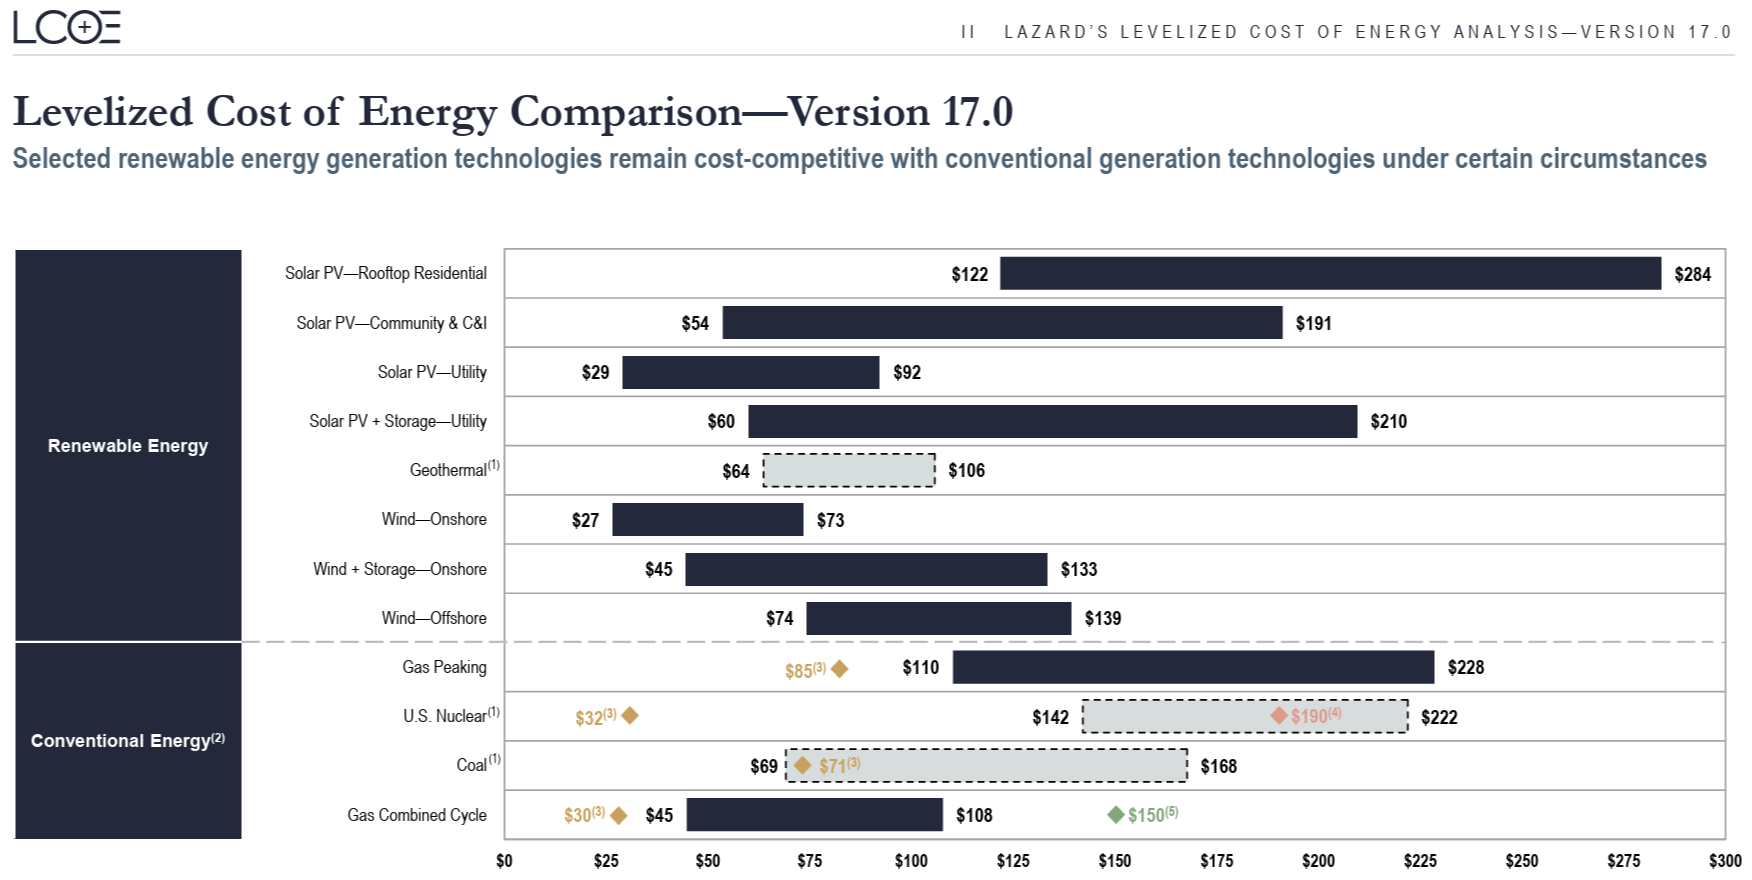
Another report on next generation energy costs can help us draw some important conclusions.
This chart is from Lazard, a highly respected advisory on energy markets. Further validating the chart that was presented by NextEra Energy Resources (see our recent post on this topic: https://lnkd.in/gaTsfSVq), the Lazard report shows that the lowest cost for new energy deployments are utility-scale solar, utility-scale onshore wind, natural gas and geothermal. Nascent sources such as small nuclear reactors have yet to make it onto the chart.
Apart from natural gas, all of these energy sources have a very low variable cost as they effectively don’t consume fuel. Meanwhile, fixed costs will continue to go down with increased manufacturing volume — and in the case of geothermal, the application of drilling and fracking technology together with skilled labor from the natural gas industry will help lower costs. (Just take a look at Fervo Energy's leadership team to see the labor shift from natural gas to geothermal energy.) All of these cost trends will benefit from increased volumes and high growth markets such as supplying energy to data centers.
Our conclusion is that we should allow the market to choose technology winners. For example, it makes more financial sense to build utility-scale solar instead of rooftop solar. As the chart from Lazard shows, utility-scale solar is now one of the cheapest forms of electricity to generate, at $.029-$.092/kWh. In comparison, rooftop solar costs 3-4 times more, at $.12-$.28/kWh.
We should also look for ways to drive down the cost of storage, whether batteries or other innovations. Incentives might have a role to play, but ultimately, we should be supporting market structures that drive down the cost of energy. Enabling an electricity market that is competitive and allows for all energy sources to be treated like commodities will favor lower-cost energy sources. If the current trends hold true, this competition will favor energy sources that are not dependent on the extraction of fuels. These sources will be both abundant and have the lowest variable costs in the future.
📚 Background reading:
• Lazard's full report: https://www.lazard.com/media/xemfey0k/lazards-lcoeplus-june-2024-_vf.pdf
• Our recent post about NextEra Energy: https://lnkd.in/gaTsfSVq
• Fervo's team: https://fervoenergy.com/team/
— Dave Welch
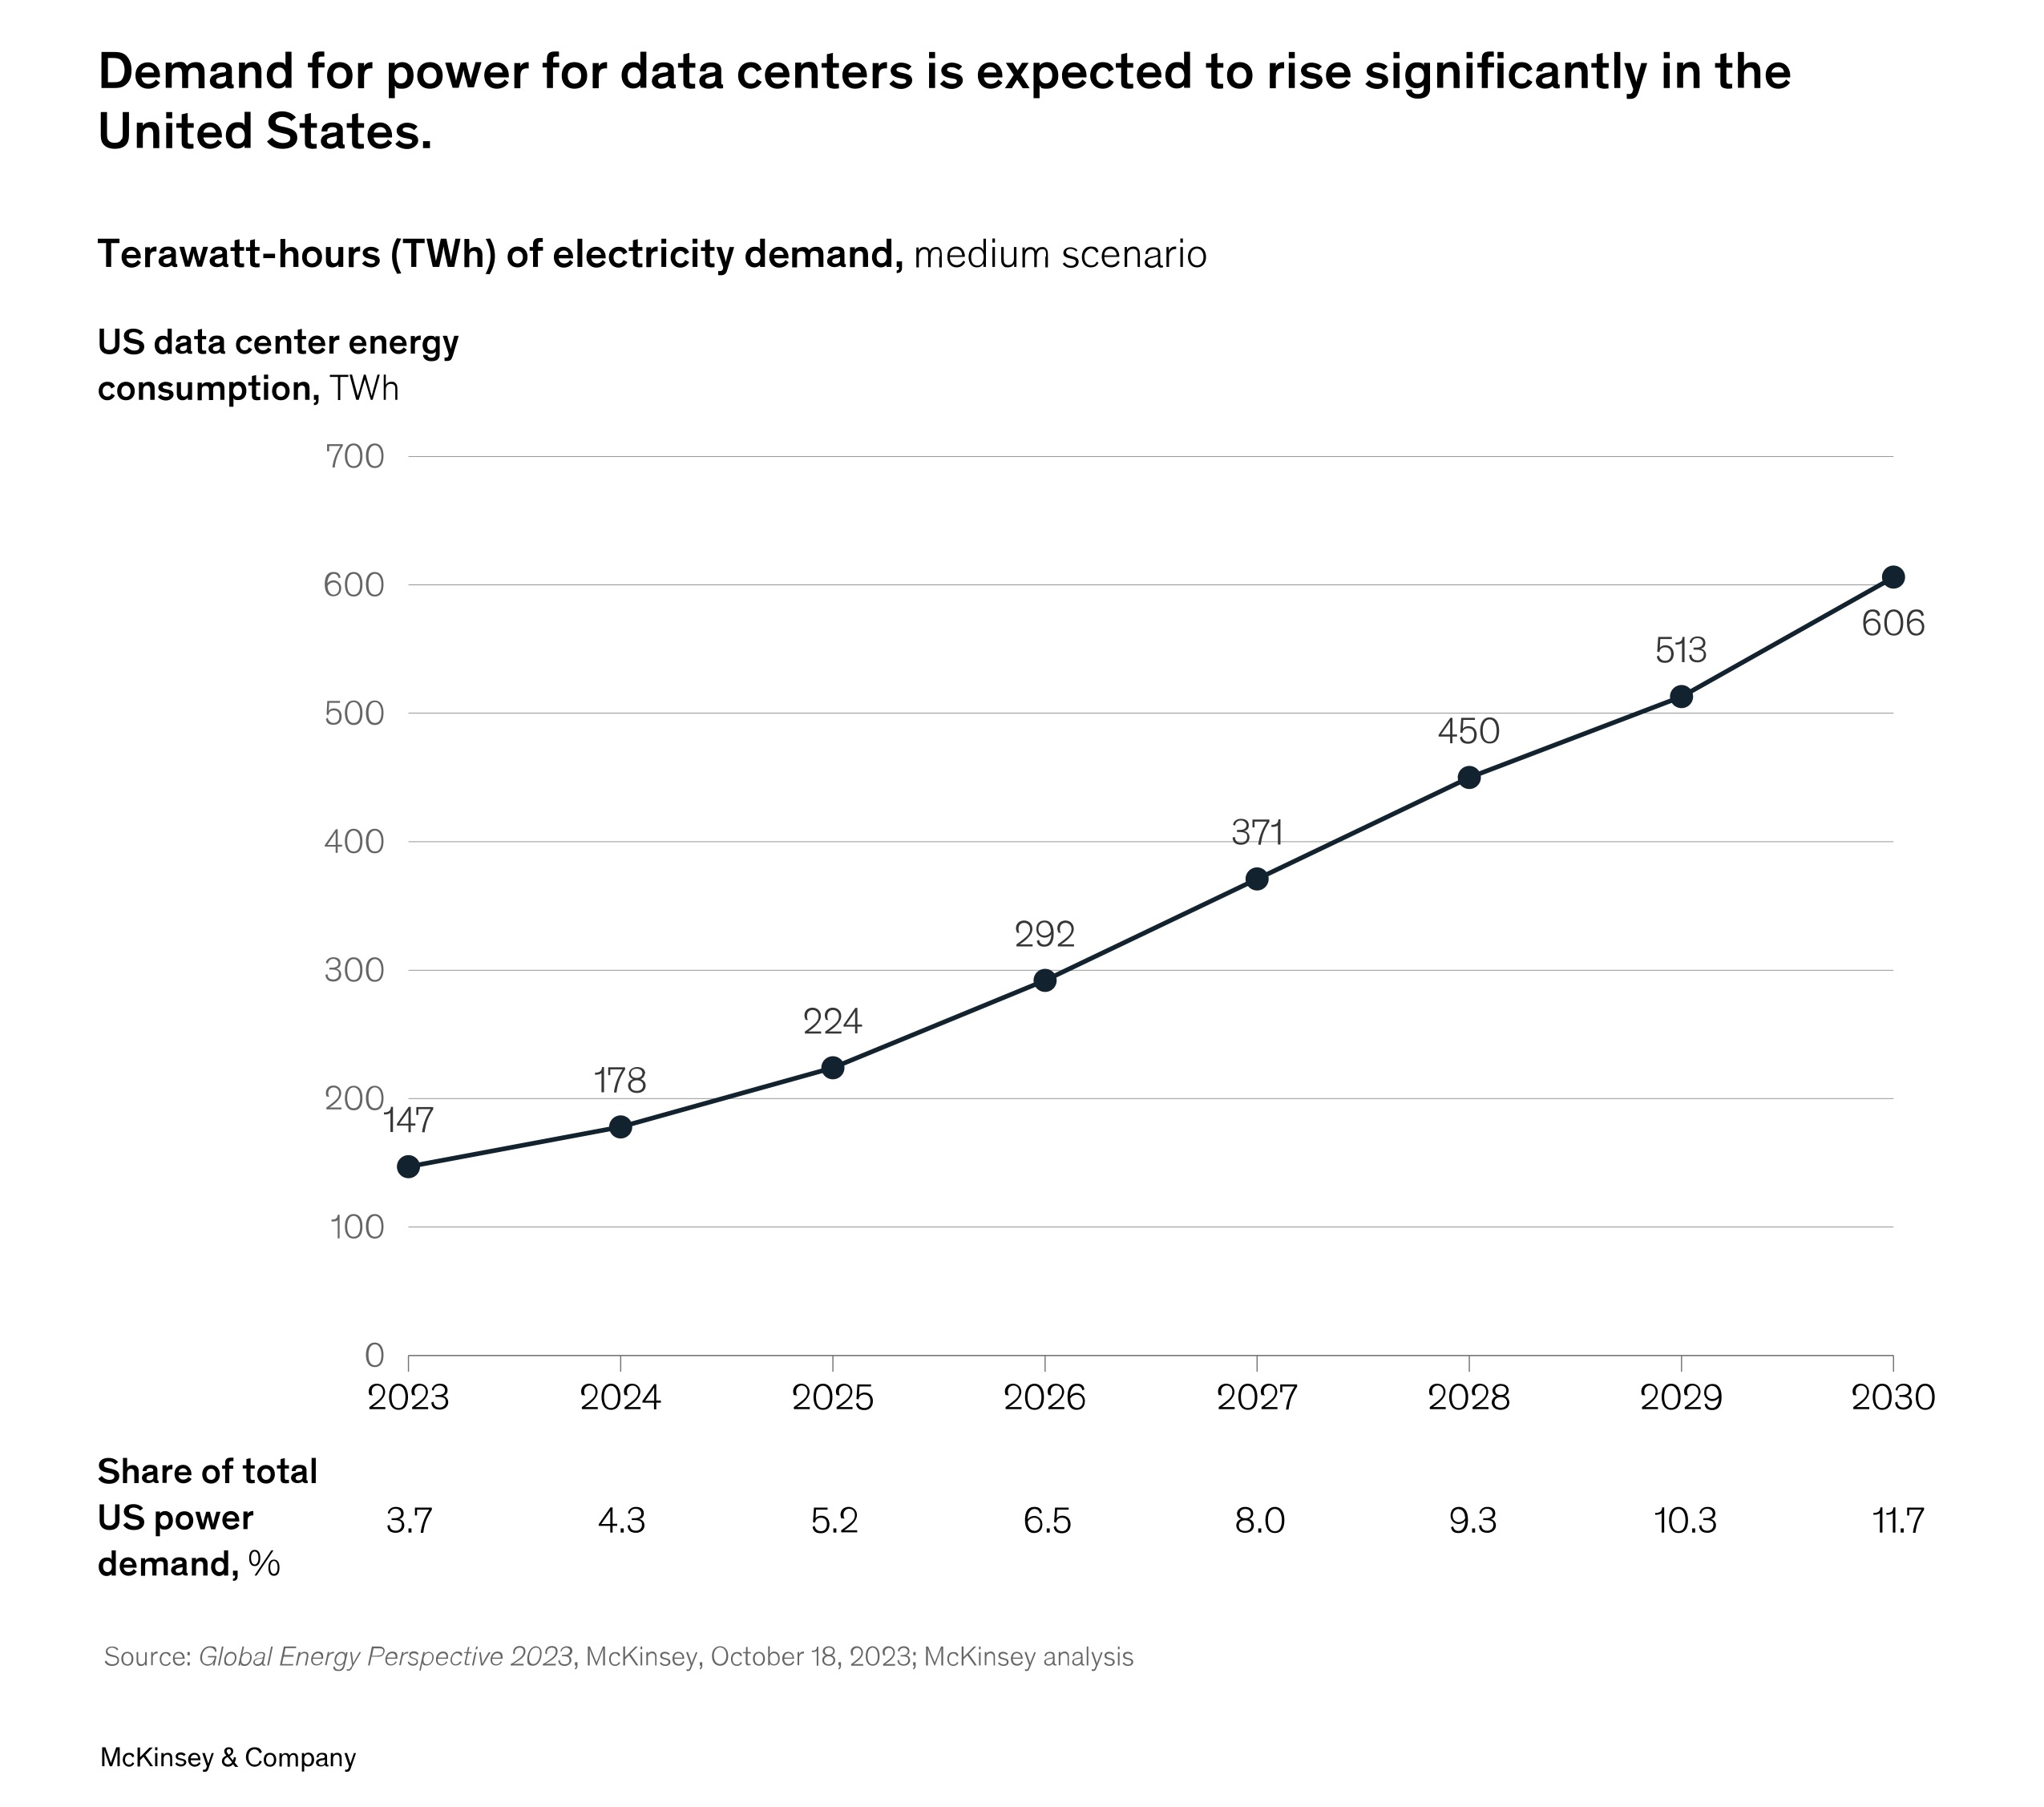
The demand for AI-ready data centers is only going to continue at a 20-25% annual growth rate. Last week’s revelations about Deepseek’s advances stirred up the industry, but the main takeaway here is clear: applications for AI are expanding even faster than previously predicted (1). Open source models will accelerate innovation and fuel a wave of new applications, from wildfire emergency planning to diagnosing disease.
These new applications will drive tremendous investment into the infrastructure needed for such powerful computing, and that means more data centers, powered by new sources of electricity. In a September 2024 report, the management consulting firm McKinsey & Co. predicted that U.S. demand for data center power will triple by 2030 — growing from 3-4% of total U.S. electricity use today to 11-12% by the end of this decade (see chart, 2). And that’s based on current trends, which we imagine may well defy current forecasts.
I’ve watched this transformation in the telecommunications industry over the past several decades. Traditional data service providers like AT&T and Verizon once catered to individuals, but today the primary consumers of gigabits are data centers themselves, many managed by the likes of Google, Meta, and Microsoft. Technologies to support data center growth have dramatically increased our information capacity at an ever-decreasing cost per bit. As a result, the uses for data have proliferated.
The question, however, is to what degree the story line of data’s meteoric growth applies to the challenge of supplying energy to data centers. As we build more data centers to feed the ravenous appetite for AI-powered applications and other uses, our decisions about electricity supply will dramatically influence the energy landscape of the future.
“Meeting this demand will require considerably more electricity than is currently produced in the United States,” writes McKinsey in its report.
As data centers consider where to buy their electricity — or whether to build their own power generation — the key challenge will be to align growing demand with innovations to support low-cost, low-carbon and abundant energy. We’re excited to see how advancements in storage, geothermal, wind, solar and other technologies can change the economics of electricity markets, but we also need to ensure that energy markets are capable of responding to this opportunity to drive towards low-cost, clean, and abundant energy sources.
📚 Background reading:
(1) Summarizing the Deepseek news: https://www.weforum.org/stories/2025/02/open-source-ai-innovation-deepseek/
(2) McKinsey’s Sept. 2024 Report: https://www.mckinsey.com/industries/private-capital/our-insights/how-data-centers-and-the-energy-sector-can-sate-ais-hunger-for-power
— Dave Welch

TRAILER: How does our brain know the difference between a banana and a school bus? And how can the neuroscience behind how humans process information about the world be applied to building smarter and more effective AI? Bestselling author and neuroscientist Jeff Hawkins and Numenta CEO Subutai Ahmad discuss their work with NosTerra CEO Dave Welch. To watch the full live event: https://youtu.be/suwFWcgK2eA?feature=shared
Note: This article was first published here.
For those of you who follow me, I care a lot about how market forces can drive our transition to an abundant, low-cost, low-carbon energy future.
🚘 First, let’s look at the energy efficiency of driving an electric vehicle.
- Electric vehicles are more efficient to drive than gasoline-powered cars. That’s largely because current EVs are 2.6 to 4.8 times more efficient at traveling a mile compared to a gasoline-powered internal combustion engine (ICE), according to data from the U.S. Department of Energy (1).
- Most of the energy contained in petroleum when operating a car is lost as heat. As 2023 data from the Lawrence Livermore Labs show, only about 22.5% of the energy contained in gasoline moves the car (2). The other 77.5% is “rejected” (aka wasted) energy. In comparison, an electric vehicle utilizes 75-80% of the electricity fed into it, according to analysis by the National Renewable Energy Laboratory (1). Some sources have reported efficiency as high as 90%. Even when considering the origin of the electricity, electric vehicles are far more efficient than ICEs.
- Because of these efficiencies, any EV model is cheaper to fill than a gas-powered vehicle, no matter what state you live in, according to a 2023 report released by the nonpartisan policy firm Energy Innovation (3).
💲 Now, let’s look at market pricing and cartels. It’s cheaper to drive an electric vehicle.
- Petroleum prices are controlled by cartels, and have been for decades. Prices have fluctuated wildly with world geopolitics and other factors outside of consumer control. Today crude oil is selling for about $75/barrel.
- In contrast, electricity is bought and sold on the grid, which is a commodity market based on supply and demand. Today electricity retail prices are approximately $0.30/kWh in California.
- If petroleum competed on the same marketplace as electricity, it would sell for $15/barrel.
- $6 trillion of additional expense to the U.S. consumer over the past 20 years is the result of petroleum-powered cars.
👉 So what does this all mean?
In his Jan. 21 executive order, President Trump said he wants to promote “true consumer choice,” and we’d like to point out simply that powering a car with electricity costs less money than using gasoline.
📚Background Reading
• DOE/NREL Vehicle Efficiency Ratios: https://www.nrel.gov/docs/fy23osti/84631.pdf
• Lawrence Livermore National Labs data: https://flowcharts.llnl.gov/sites/flowcharts/files/2024-12/energy-2023-united-states.png
• Energy Innovation report: https://energyinnovation.org/publication/how-much-does-it-cost-to-fill-up-an-electric-vehicle-vs-a-gas-powered-car/
— Dave Welch
Note: This article was originally published here.
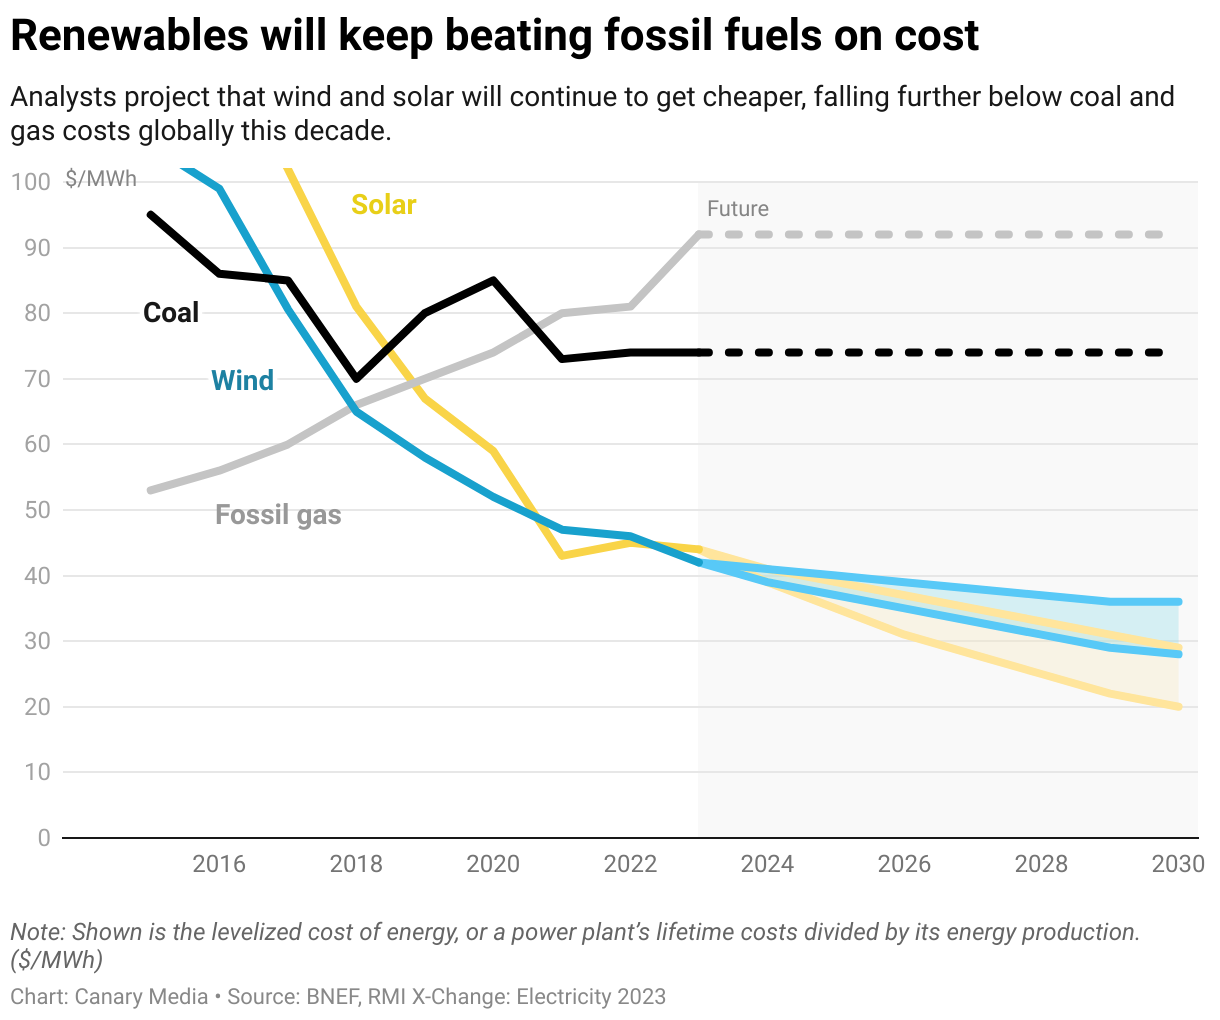
The adoption of clean energy continues to drive down the overall cost of electricity. As the chart shows, the cost of generating solar and wind power has been plummeting, dropping from hundreds of dollars per megawatt-hour to under $50. At the same time, California has transitioned more than a quarter of its electric grid to solar and wind sources, which now account for 27.8% of our power, according to 2022 data from the CA Energy Commission (1).
Experts agree that the prices of solar and wind will continue to drop. As a Canary Media reporter lays out, “By 2030, technology improvements could slash today’s prices by a quarter for wind and by half for solar.” (2)
Therefore, as the cost of renewable energy drops, Californians should be reaping those rewards in their electricity bills. The conversion to green energy should not only benefit our climate, but our pocket books.
Instead, we’re seeing the opposite.
A report released last week by the Legislative Analyst’s Office has been generating headlines: California has the second highest residential electricity rates in the nation (behind only Hawaii). And our rates continue to climb — faster than the rate of inflation and faster than in other states. Moreover, climbing electricity rates endangers the state’s important climate goals of increasing electrification, the LAO points out in its report (3).
To understand more about the factors that feed into California’s high electricity rates, check out this KQED article (https://lnkd.in/gRMFAweb) or read the LAO’s report, but the key takeaway we want to point out is:
Our current system fails to harness the ability of the free market to influence the quantity, quality and price of electricity in this state. Energy is a complicated sector where public interests intersect with profit motives, but we need to create the right incentives to help us transition rapidly towards a green, carbon-neutral future.
📚 Background reading:
(1) CEC 2022 data: https://www.energy.ca.gov/data-reports/energy-almanac/california-electricity-data/2022-total-system-electric-generation
(2) Chart: Renewables are on track to keep getting cheaper and cheaper: https://www.canarymedia.com/articles/clean-energy/charts-renewables-are-on-track-to-keep-getting-cheaper-and-cheaper
(3) LAO report: https://lao.ca.gov/Publications/Report/4950
— Dave Welch

Looking back on this year, we're proud of what NosTerra has accomplished. We began the year with the question: How would you spend $100 billion to fight climate change? We heard many thought-provoking answers from policy experts, entrepreneurs, and other creative thinkers and continue to see the value and opportunity of investment in clean, low-cost and abundant energy. Leading up to the elections, we hosted several informative roundtables about deepfakes, AI, and election security. No matter how you might feel about the outcome, we continue to believe that America’s democracy is worth protecting. Throughout the year, we’ve tackled one of the toughest questions in the energy sector: How can we achieve a carbon-neutral future while keeping the cost of electricity down? If you had the opportunity to join our live events and webinars, or to watch our videos, you’d see lively discussions on topics ranging from integrated design to the market’s influence on energy infrastructure. Stay tuned for more work and news on the clean energy front in 2025!We’re ending this year filled with gratitude to you, our community, for your support and engagement, and hope to deepen our conversations in the new year. We wish you happy holidays and a joyful new year!
If California is to achieve its ambitious goal of providing 100% carbon-free electricity to its residents by 2045 (which was mandated in 2018 by Senate Bill 100) it will take more than legislation. Edison International CEO Pedro Pizarro, whose company provides electricity to over 15 million customers in southern California, sat down with our CEO Dave Welch to discuss the important role that hashtag#technology and hashtag#investment play in transitioning to a hashtag#netzero power grid.
"I'm grateful for folks in the venture capital community like [NosTerra Ventures] who are helping to make that happen with new technologies,” Pedro said. “Investment is critical. It’s a lot about public private partnership.”
To achieve an aggressive goal of net zero, we’ll need to enlist the markets. The conversion of our energy system is likely the largest market transformation that will happen in our lifetime. This will require investments in new technologies like battery storage and a diverse array of clean energy sources, including next-generation geothermal, hydrogen fuels, and natural gas-fired power plants coupled with carbon capture and storage. We’ll also need ambitious levels of investment and innovation — to match our climate ambitions.
We're grateful that Pedro took the time to discuss what it will take to keep the lights on for millions of Californians while reducing our carbon footprint!
📚 Background reading:
• https://lnkd.in/g9Zpy_f5
• https://lnkd.in/gFkfctex
[Archival photography courtesy of Frank Schulenburg and The Oaked Ridge]
Join Our Community of Innovators
Become part of a movement tackling the world's most pressing challenges through innovation and collaboration.