Reducing the Cost of Energy
Note: This article was originally published here
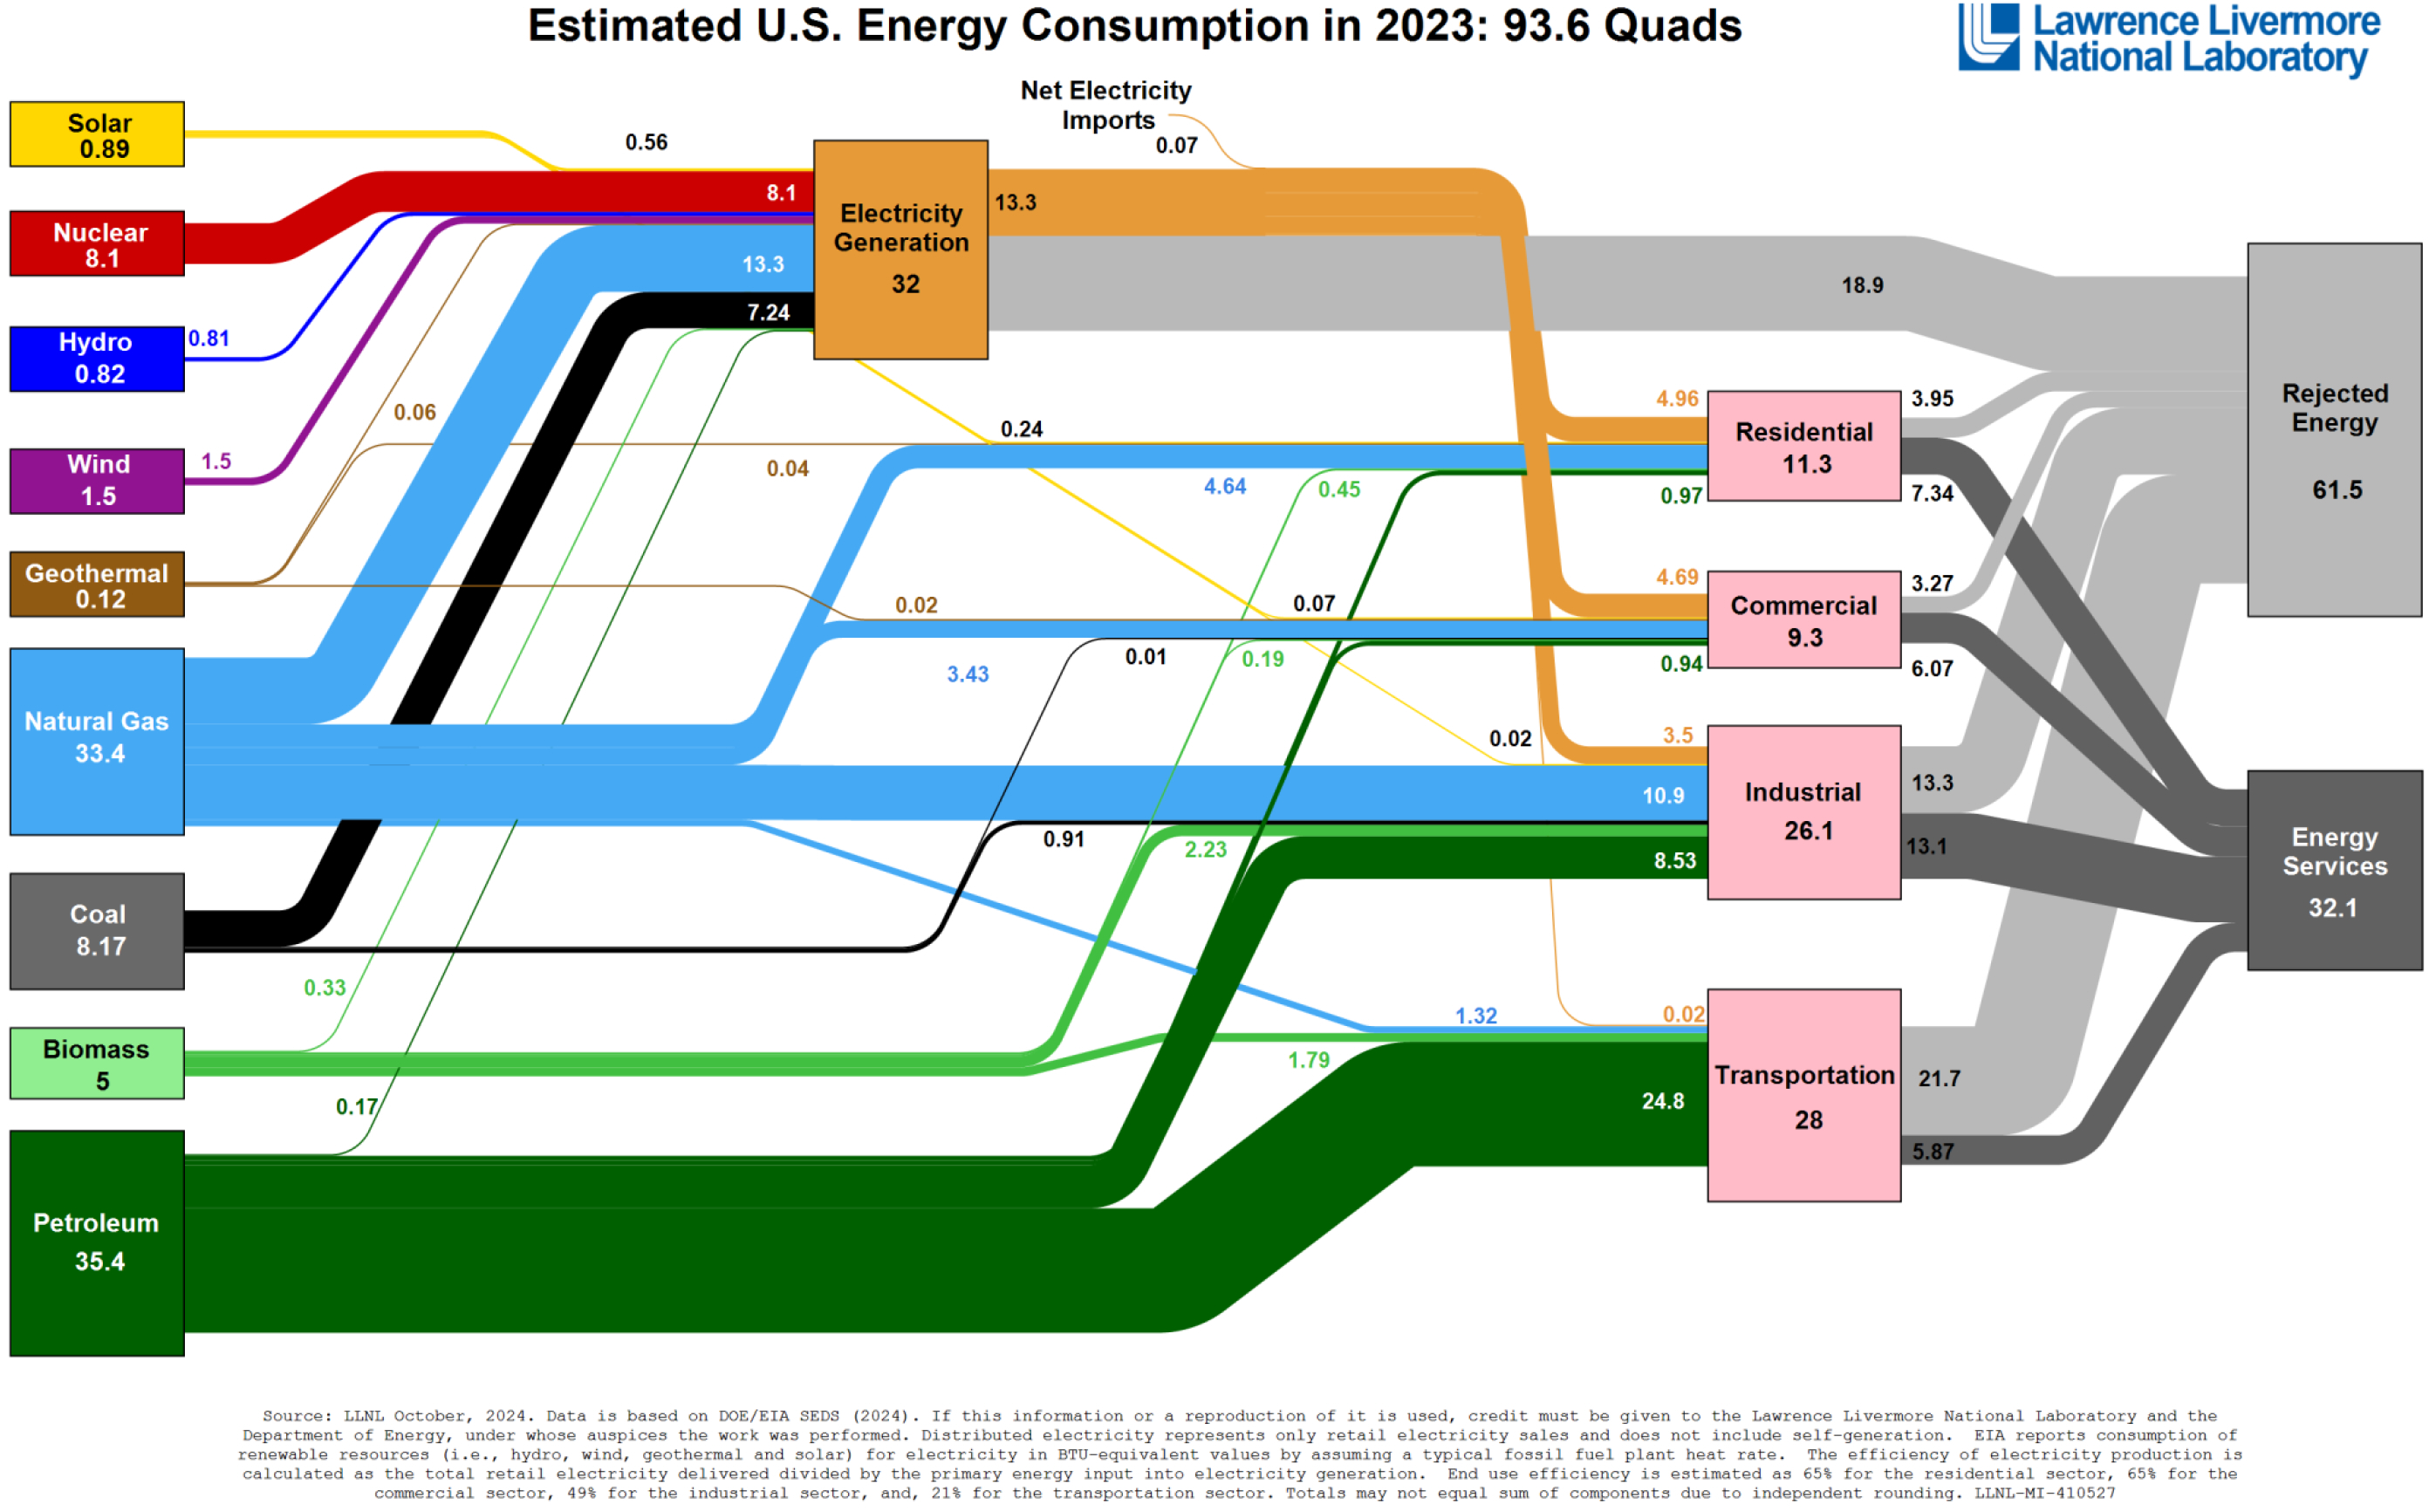
This is one of my favorite charts about energy, a sankey diagram showing U.S. energy flow in 2023, published by Lawrence Livermore National Laboratory (DOE).
The chart shows where energy is coming from and where energy is being used, and here’s my biggest takeaway: If we adopted more efficient energy sources, both emissions and the price of energy could be dramatically reduced.
Let’s dig in. The first item to note is that currently roughly 2/3’s of all energy is lost as heat (what’s labeled as “rejected energy” on the chart). That’s a lot of wasted energy.
The chart also shows three very different energy markets: the electricity grid, the petroleum-fueled transportation market, and the natural gas-based industrial or point-of-load market. Of these three markets, only the electricity market allows different energy types to compete head-to-head on a price basis.
Petroleum markets are influenced by cartel pricing, as discussed in prior posts, and as a result, are substantially more expensive per unit of work performed. In addition, petroleum energy conversion is highly inefficient. In the U.S. transportation sector, 28 quads of energy (89% of which is petroleum) were input and only 5.87 quads of work were output — that’s only 20% efficient.
In comparison, electricity generation is 42% energy efficient (note the 13.3 quads of work done coming from an input of 32 quads of energy). That’s more than double the efficiency.
And that’s one of the reasons it makes sense for the transportation sector to electrify.
The electricity grid is supplied by 41% natural gas, 35% no- and low-carbon sources, and 22% coal. Trend lines show that coal is losing market share to natural gas and clean energies, a change that’s driven by coal’s greater cost structure.
Based on price, the market’s natural tendencies will support increasing market share for natural gas and clean energy technologies.
The difference in carbon emissions is also substantial. Currently, the transportation sector emits 312 million metric tons of carbon for each quad of work performed, while the electric grid emits 115 million metric tons of carbon per quad. This is a 2.7x difference in carbon emissions.
A competitive market is critically important in determining the economics of our energy system and in moving us towards a clean energy transition. In parallel, we should electrify transportation and replace the costly and dirty energy sources on the current electricity grid (namely coal and older natural gas plants) with lower cost, cleaner, and abundant energy sources.
📚 Background reading
• If you visit LLNL’s website, you can pull up additional flow charts by state and by year: https://lnkd.in/gs4XqSqa
• My previous post about cartel pricing in petroleum markets: https://lnkd.in/gFR_7qUC
— Dave Welch